Prometheus
Prometheus (Prometheus) is a monitoring system originally built on the SoundCloud. Since 2012, it has become a community open source project with a very active developer and user community. In order to emphasize open source and independent maintenance, Prometheus joined the Cloud Native Cloud Computing Foundation (CNCF) in 2016, becoming the second hosting project after Kubernetes.
Grafana is an open source measurement analysis and visualization suite. A front-end tool developed purely Javascript displays custom reports and charts by accessing libraries (such as InfluxDB). Grafana supports many different data sources. Each data source has a specific query editor, and the features and functions customized by the editor are the specific data sources that are exposed. The Prometheus is exactly one of its supported data sources.
This article introduces how Midway accesses Grafana + Prometheus.
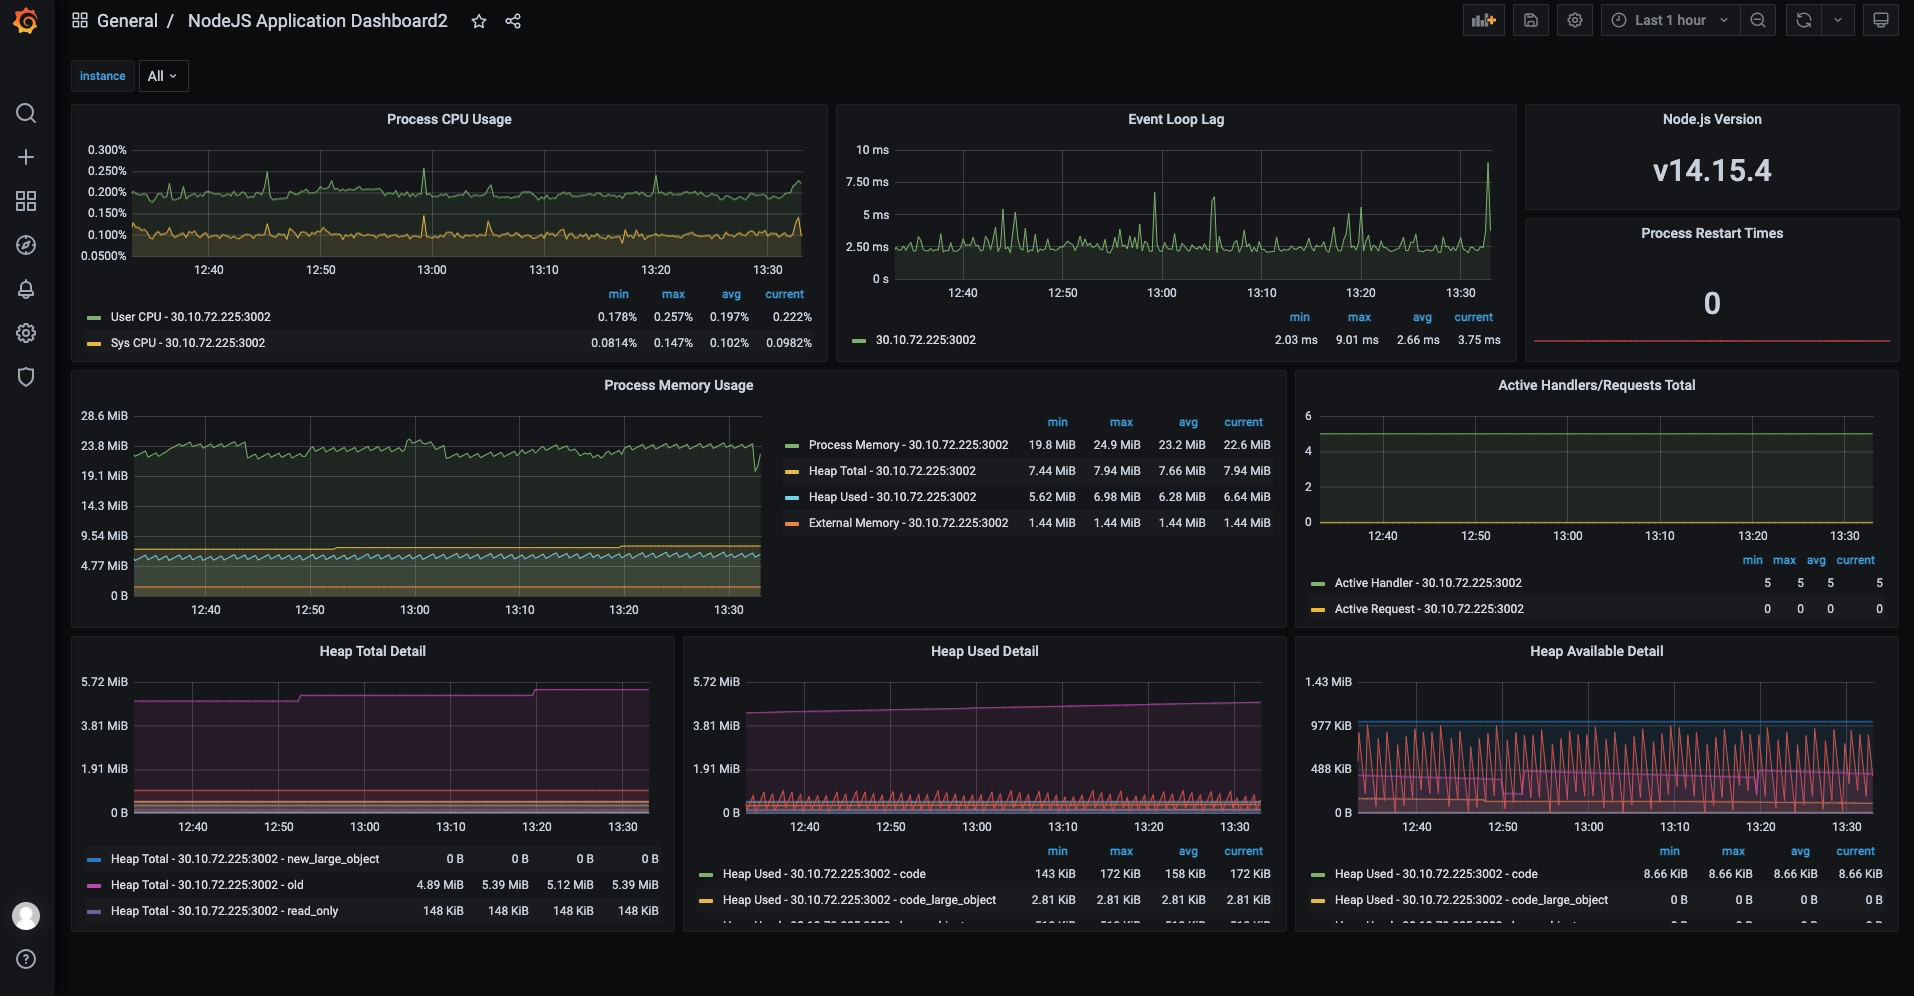
The access effect is as follows:
Installation dependency
First install the indicator monitoring component provided by Midway:
$ npm install @midwayjs/prometheus@4 --save
Or reinstall the following dependencies in package.json.
{
  "dependencies": {
    "@midwayjs/prometheus": "^4.0.0",
    // ...
  },
  "devDependencies": {
    // ...
  }
}
Introducing components
In configuration.ts, introduce this component:
// src/configuration.ts
import { Configuration } from '@midwayjs/core';
import * as prometheus from '@midwayjs/prometheus'; // Import module
import { join } from 'path';

@Configuration({
  imports: [
    // ...
    prometheus
  ],
  importConfigs: [join(__dirname, 'config')]
})
export class MainConfiguration {}
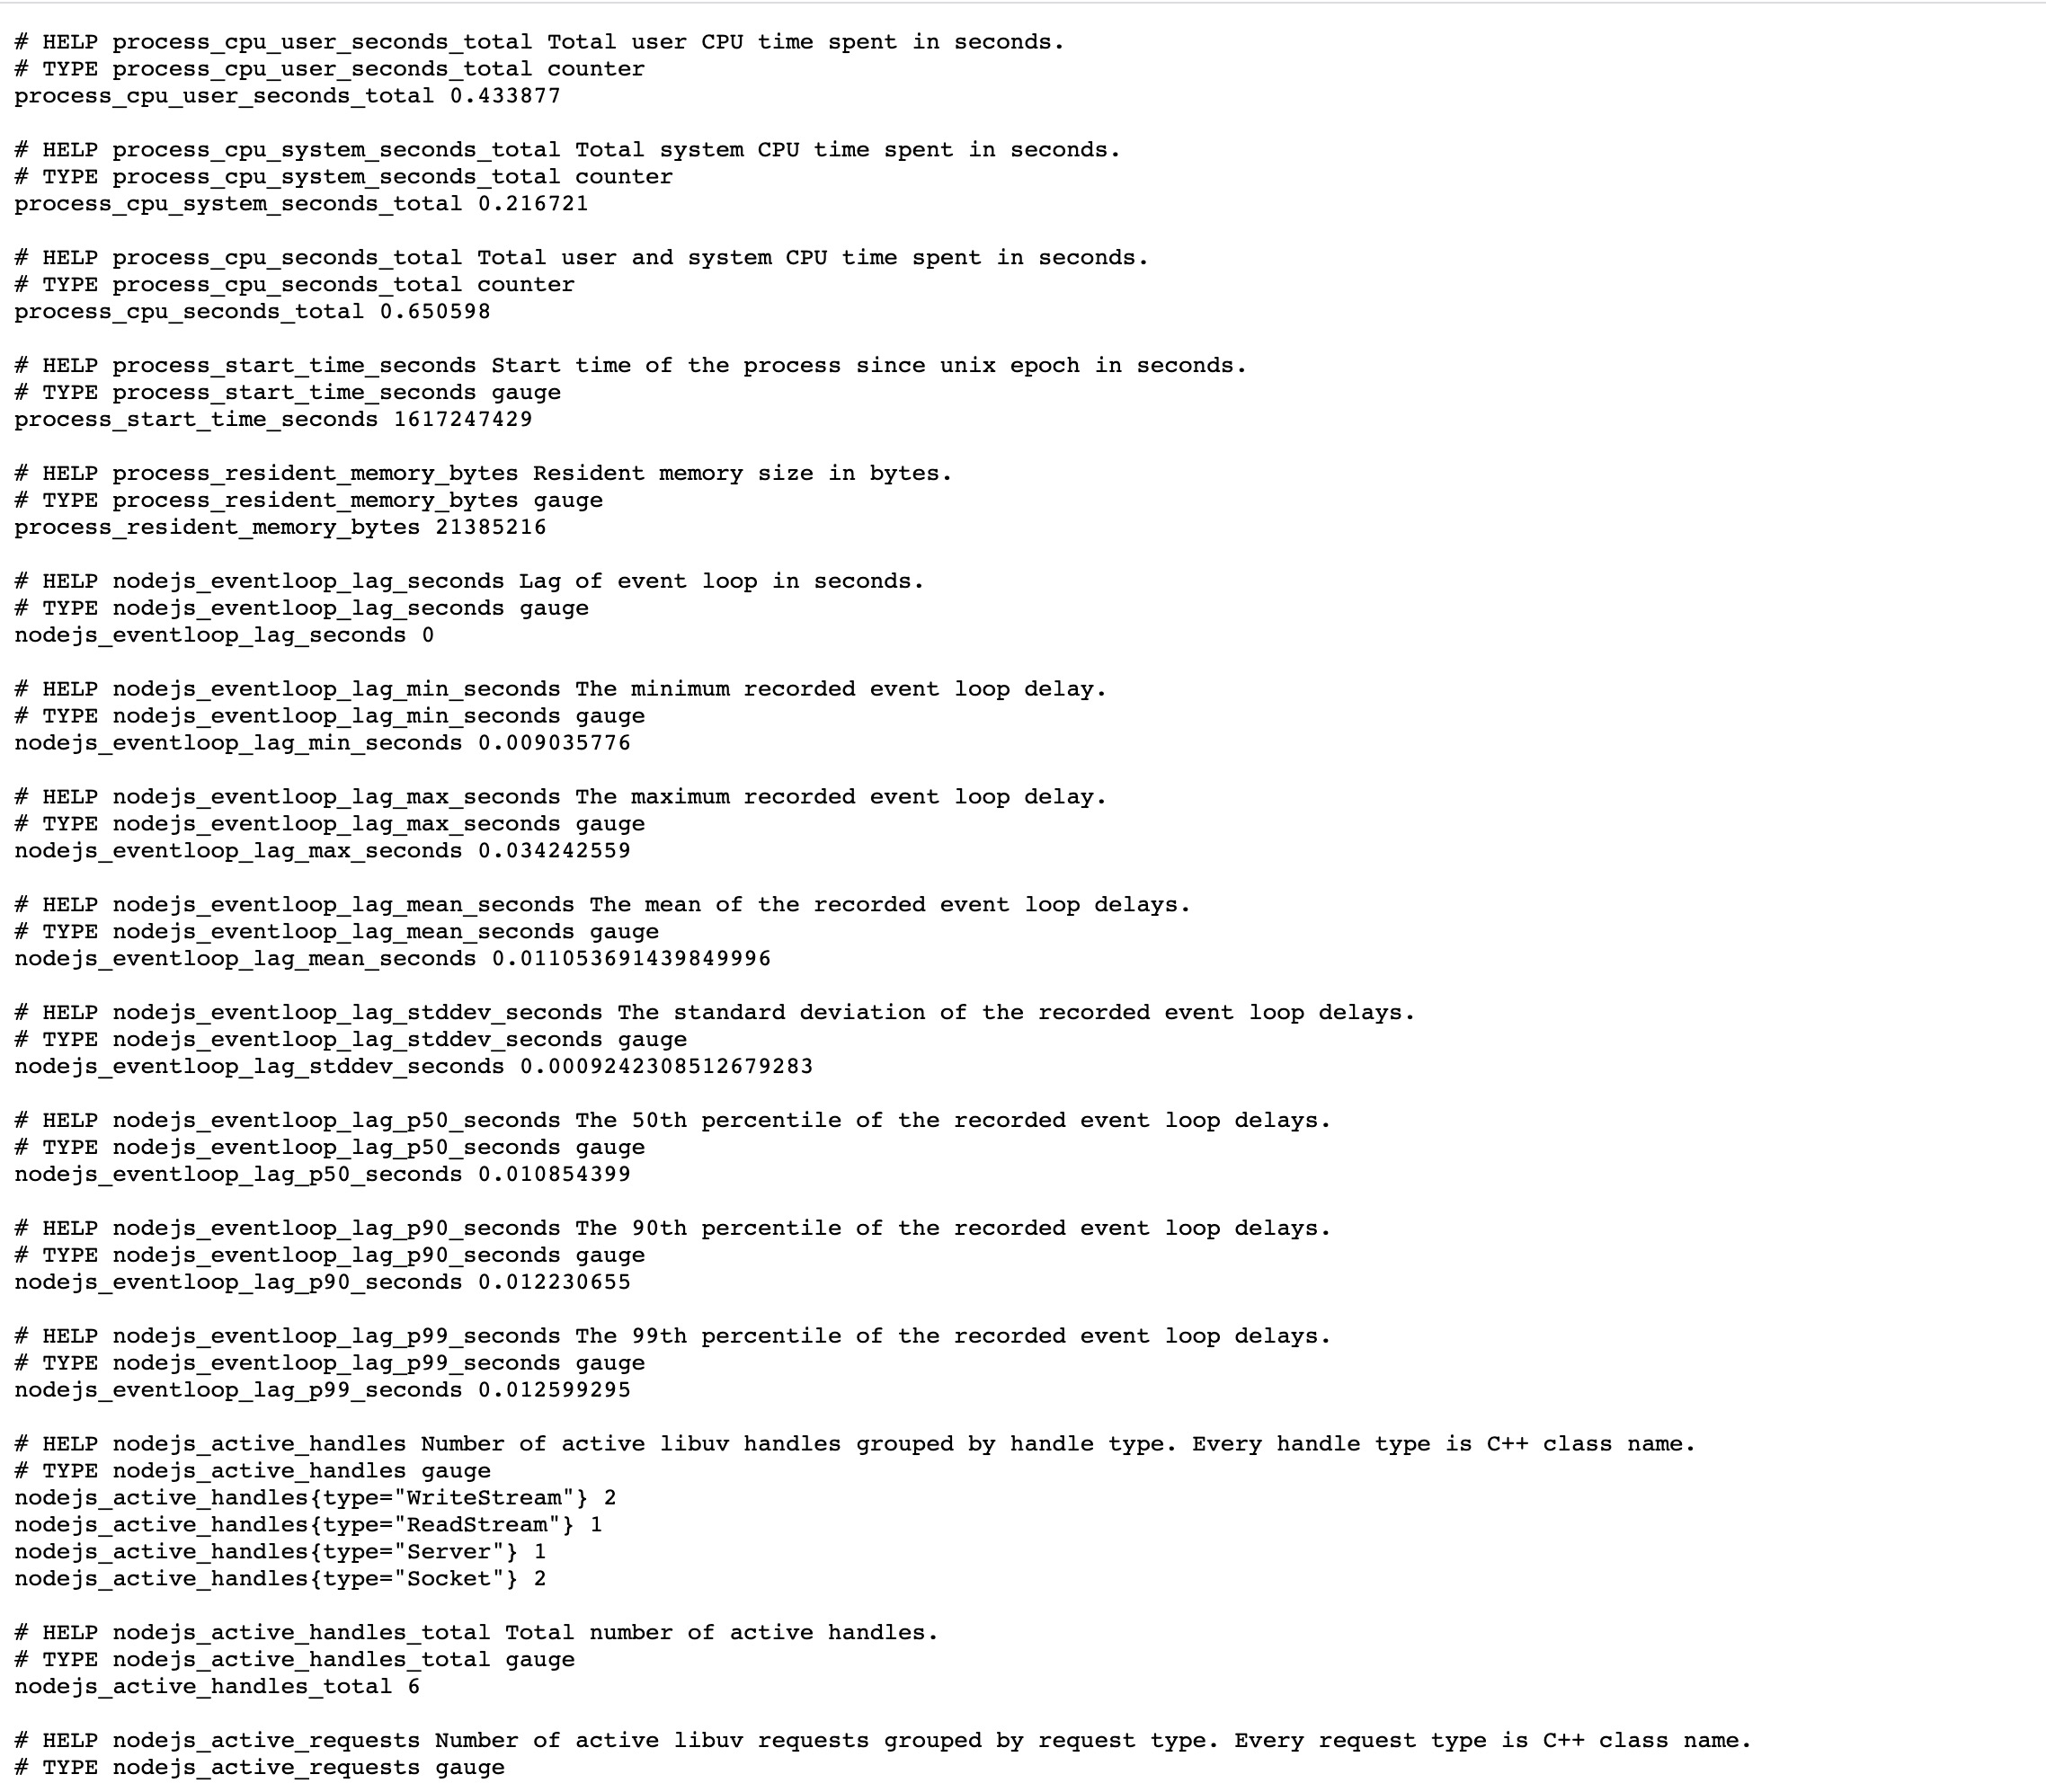
When we started our application, there was an extra ${host }:${ port}/metrics when we visited it.
Prometheus the monitoring data is obtained based on HTTP, please include one of web/koa/express component..
Access interface, return as follows, the contents are the current indicators.
Other configurations
The indicator component also provides relevant configurations to facilitate developers to configure.
You can modify the configuration of the prometheus in config.default.ts.
// src/config/config.default
export default {
  // ...
  prometheus: {
    labels: {
      APP_NAME: 'demo_project',
    },
  },
}
For more configurations, we can look at the definitions for configuration.
Through configuration, for example, we can classify which nodes are the same application, because when we deploy, the node program is distributed. For example, we added APP_NAME above to distinguish different applications, so that we can distinguish different applications in the monitoring index.
Data acquisition
The components we introduced earlier in Midway are mainly to add indicator modules to Node. Next, we need Prometheus to collect our index data.
If the developer's department already has Prometheus + grafana, it only needs to report the application's indicator address to PE or through the interface. Here we assume that everyone has no Prometheus + grafana, and then follow the following description.
Deploy Prometheus
Here we use docker-compose to build Prometheus. The docker-compose.yml file is as follows:
version: '2.2'
services:
  tapi:
    logging:
      driver: 'json-file'
      options:
        max-size: '50m'
    image: prom/prometheus
    restart: always
    volumes:
      - ./prometheus_data:/prometheus_data:rw
      - ./prometheus.yml:/etc/prometheus/prometheus.yml
      - ./targets.json:/etc/prometheus/targets.json
    command:
      - '--storage.tsdb.path=/prometheus_data'
      - '--config.file=/etc/prometheus/prometheus.yml'
      - '--storage.tsdb.retention=10d'
      - '--web.enable-lifecycle'
    ports:
      - '9090:9090'
The prometheus.yml file is as follows:
global:
  scrape_interval: 15s # Set the scrape interval to every 15 seconds. Default is every 1 minute.
  evaluation_interval: 15s # Evaluate rules every 15 seconds. The default is every 1 minute.
scrape_configs:
  - job_name: 'node'
    file_sd_configs:
      - refresh_interval: 1m
        files:
          - '/etc/prometheus/targets.json'
  - job_name: 'prometheus'
    static_configs:
      - targets: ['localhost:9090']
Then, the collected targets.json is as follows: ${ip} in the following file is replaced with the ip address of the server where the Node.js application is located.
[
  {
    "targets": ["${ip}:7001"]
    "labels": {
      "env": "prod ",
      "job": "api"
    }
  }
]
Then we start the docker-compose.yml file,
$ docker-compose up
At this point, Prometheus will already pull the indicator data of our Node application.
What to do if you want to update target: After modifying this targets.json file, it is hot loaded by the prometheus reload method. The method is as follows:
$ curl-X POST http://${prometheus ip}:9090/-/reload
Then we can check the prometheus page or confirm whether it takes effect. The interface address is:
http://${prometheus ip}:9090/classic/targets
The next step is how to show the collected data.
Data presentation
We can use Grafana to show our data.
Here we simply use Docker to build a Grafana:
$ docker run -d --name=grafana -p 3000:3000 grafana/grafana
You can also put grafana and prometheus together and use docker-compose for unified management.
Add grafana to docker-compose.yml, example:
version: '2.2'
services:
  tapi:
    logging:
      driver: 'json-file'
      options:
        max-size: '50m'
    image: prom/prometheus
    restart: always
    volumes:
      - ./prometheus_data:/prometheus_data:rw  # prometheus Data mapping directory
      - ./prometheus.yml:/etc/prometheus/prometheus.yml # prometheus Configuration mapping file
      - ./targets.json:/etc/prometheus/targets.json
    command:
      - '--storage.tsdb.path=/prometheus_data'
      - '--config.file=/etc/prometheus/prometheus.yml'
      - '--storage.tsdb.retention=10d'
      - '--web.enable-lifecycle'
    ports:
      - '9090:9090'
  grafana:
    image: grafana/grafana
    container_name: "grafana0"
    ports:
      - "3000:3000"
    restart: always
    volumes:
      - "./grafana_data:/var/lib/grafana" # grafana data mapping directory
      - "./grafana_log:/var/log/grafana"  # grafana log mapping directory
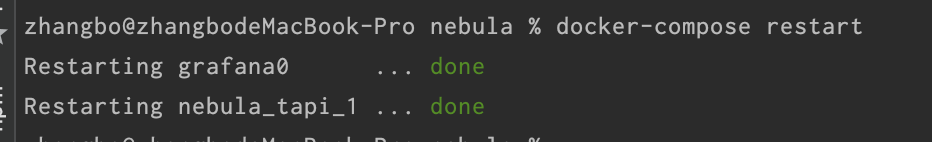
Restart the docker-compose.yml file
docker-compose restart
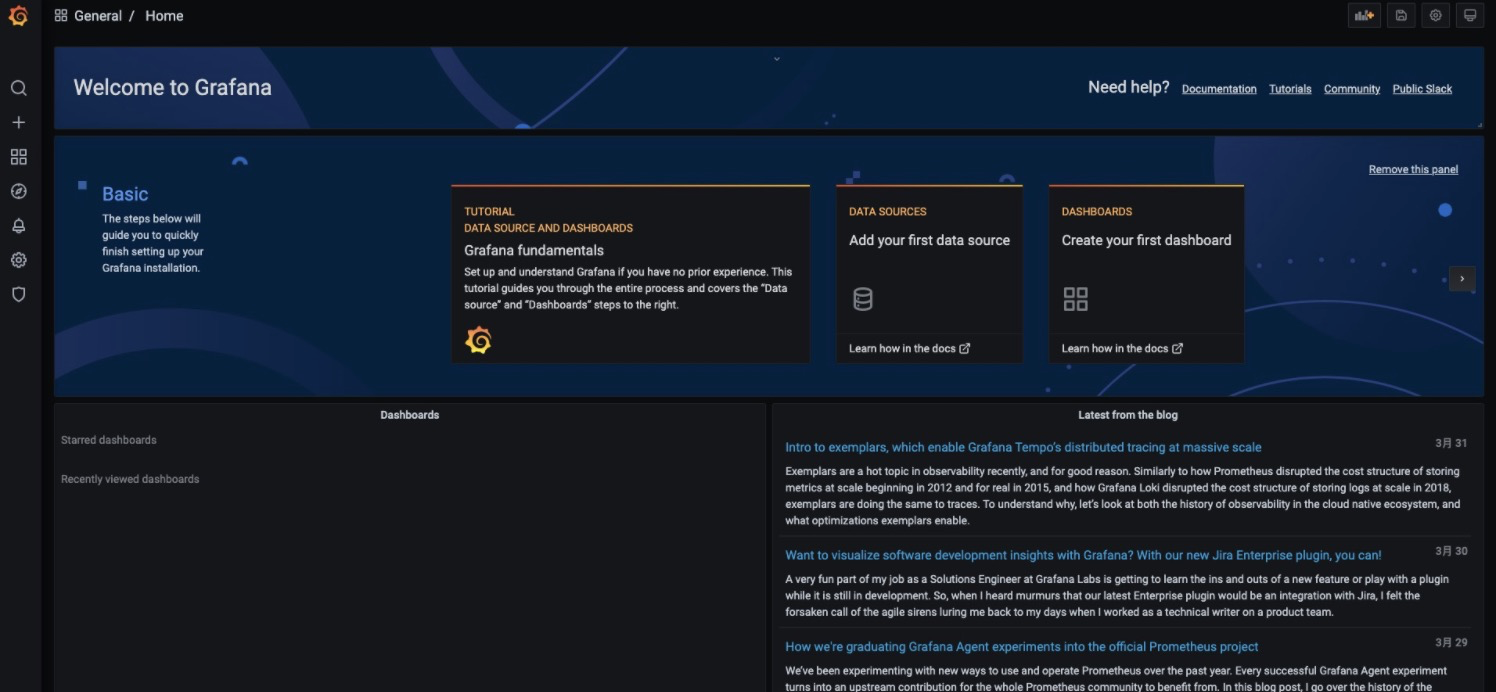
Complete any of the above, and then we access 127.0.0.1:3000, the default account password: admin:admin.
After the visit, the effect is as follows:
Then we let Grafana access our Prometheus data sources:
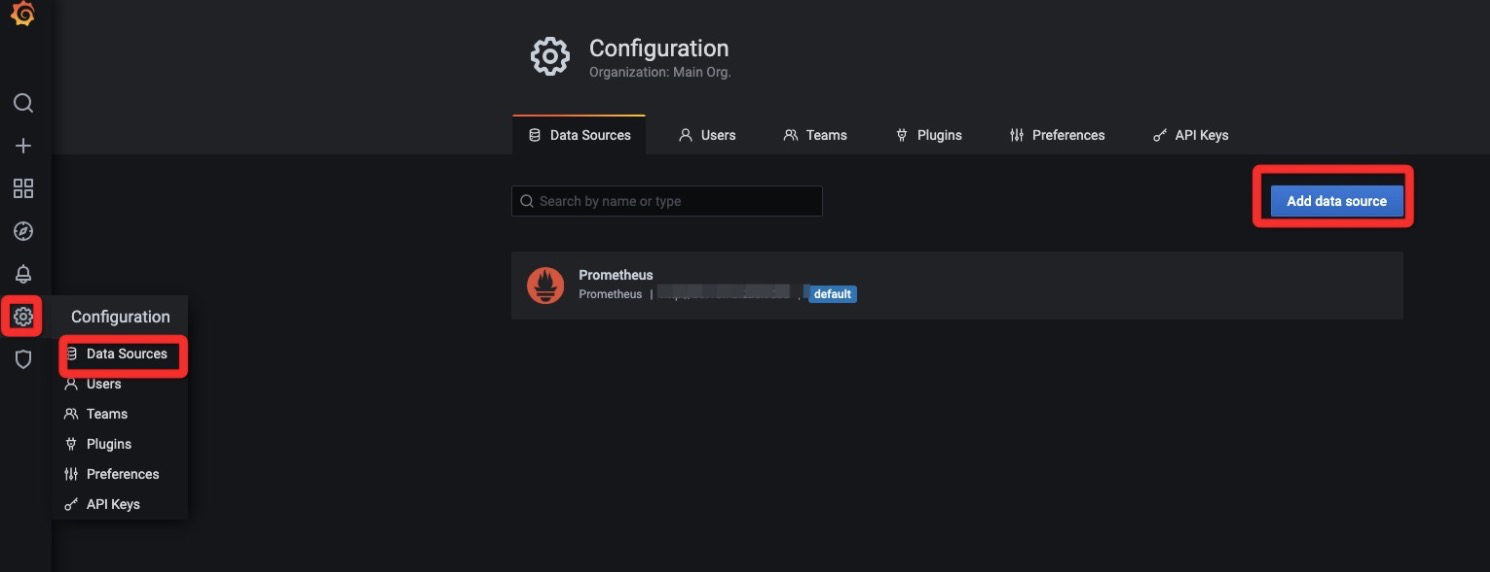
Then we click Grafana to add the chart:
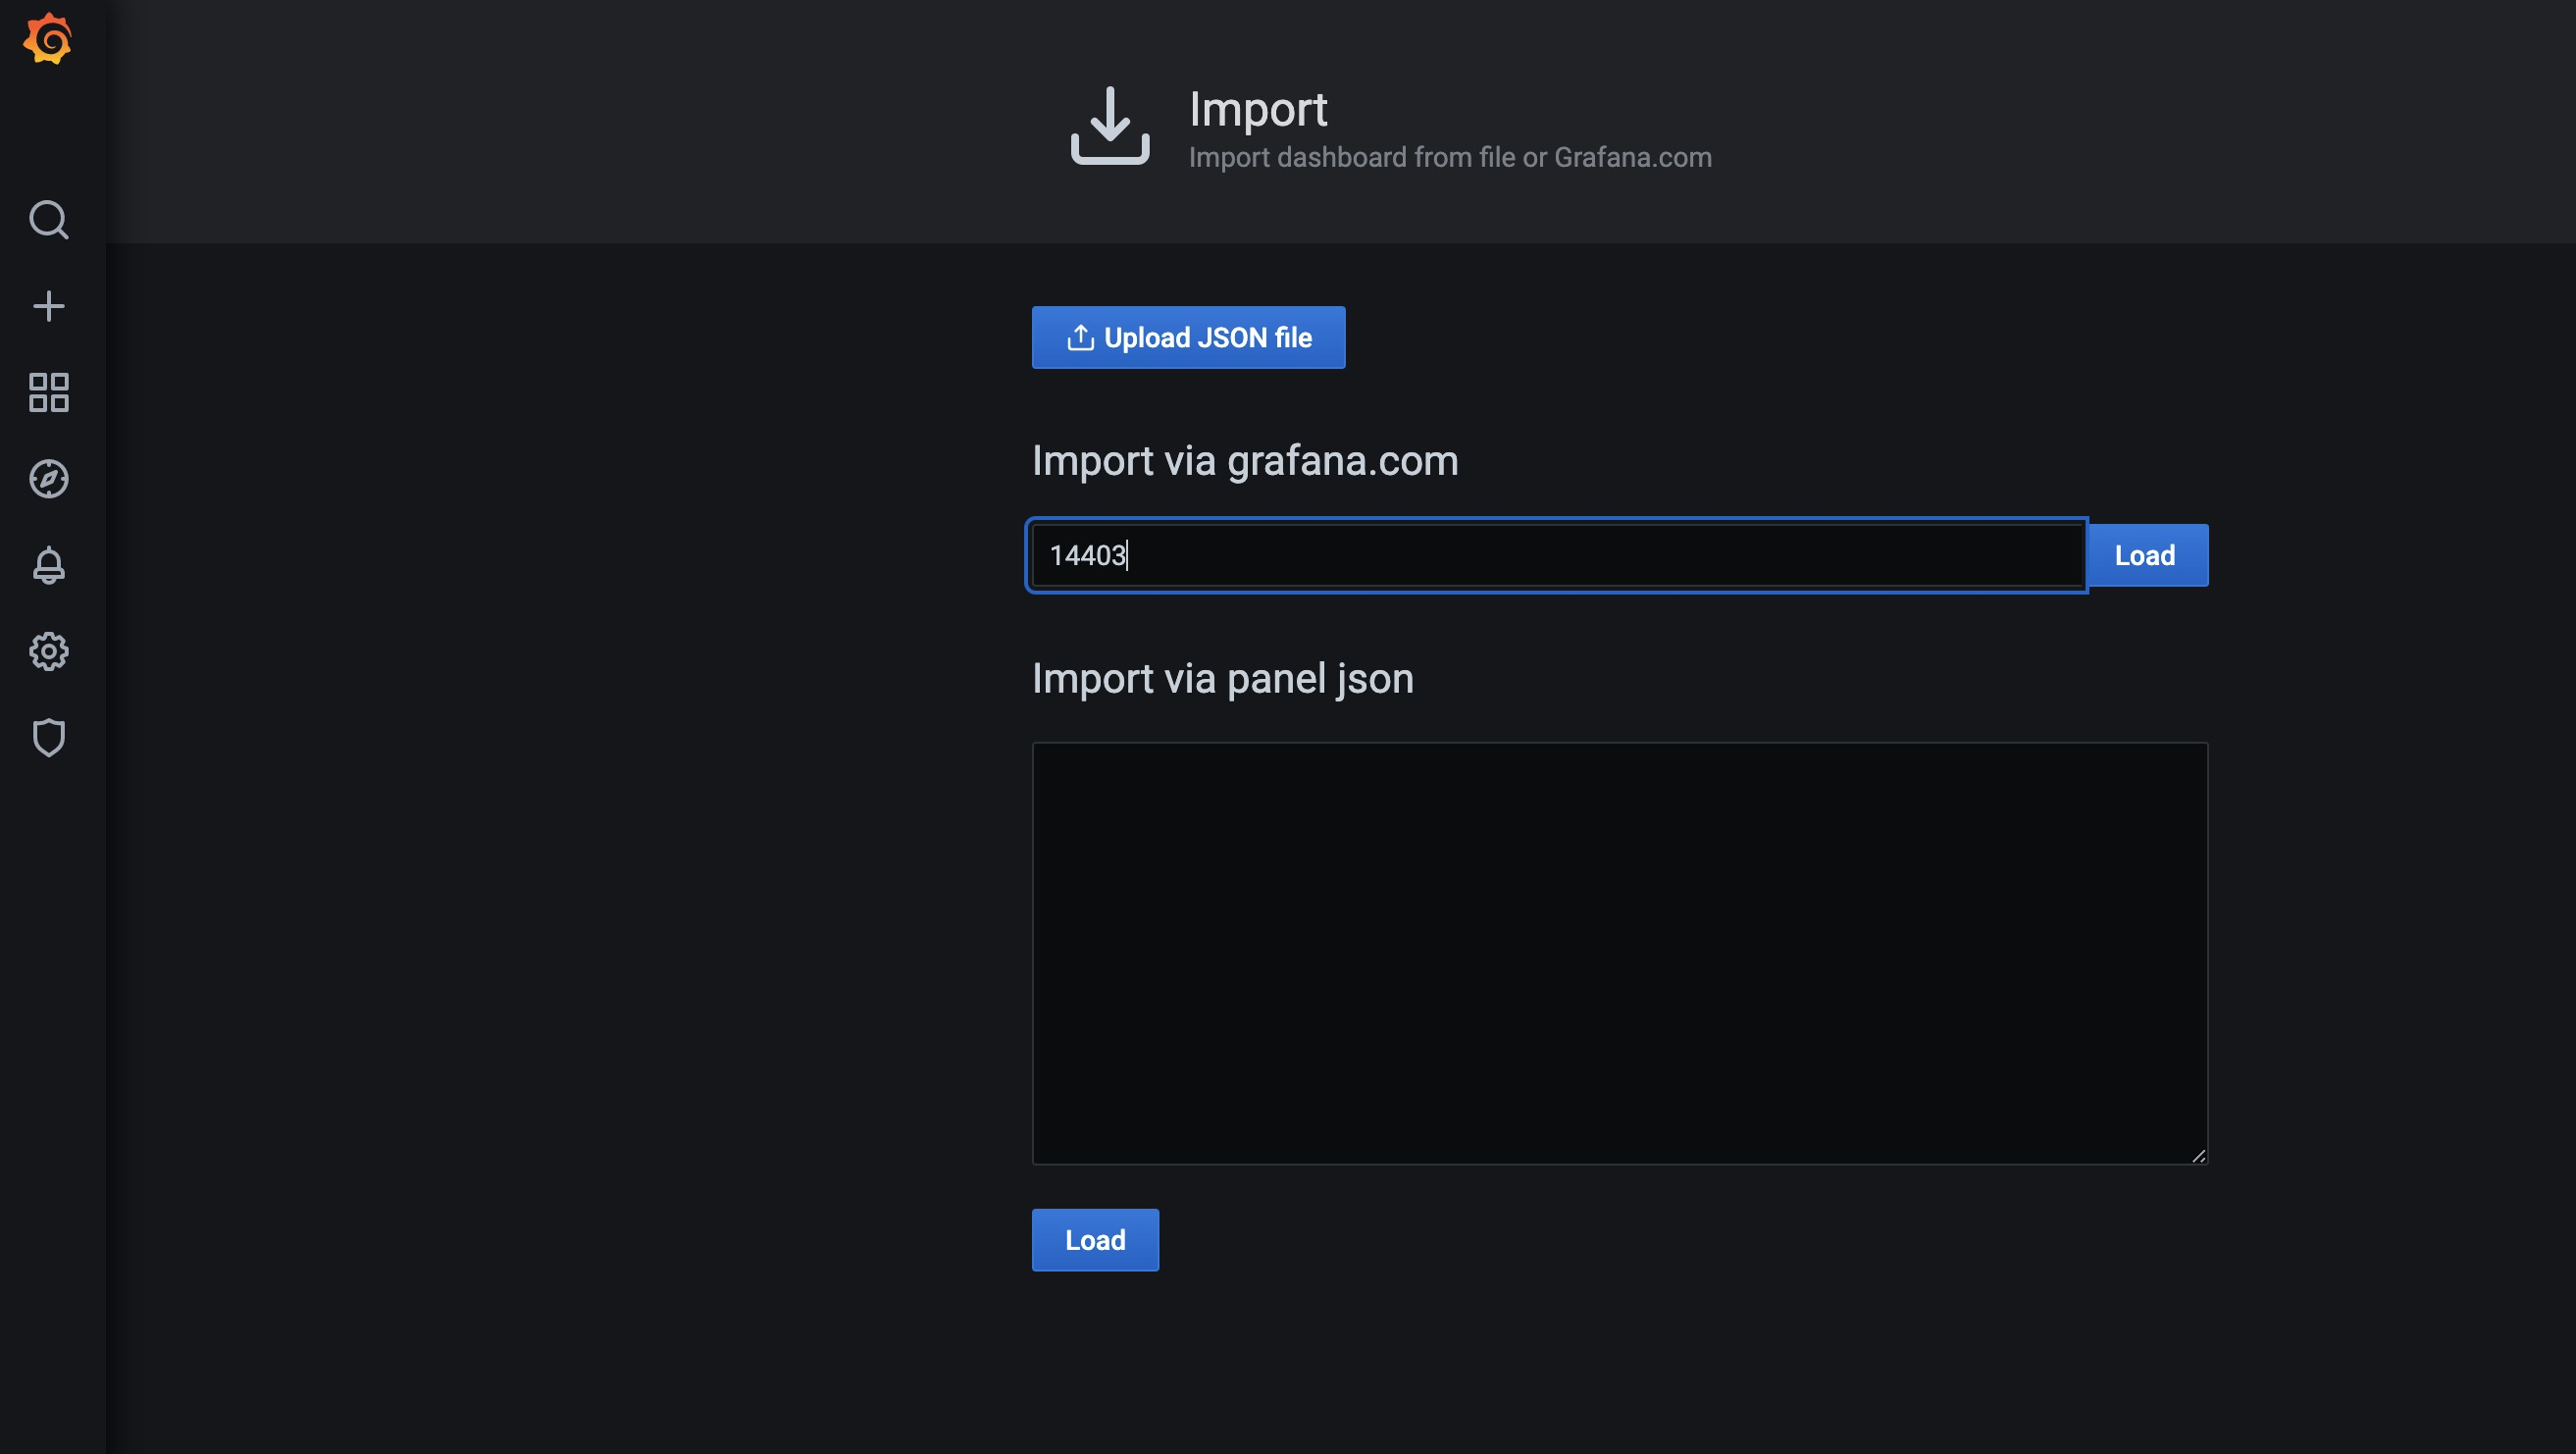
Select 14403 ID here, then click load, then click Next, and then click import to see the effect we have just accessed.
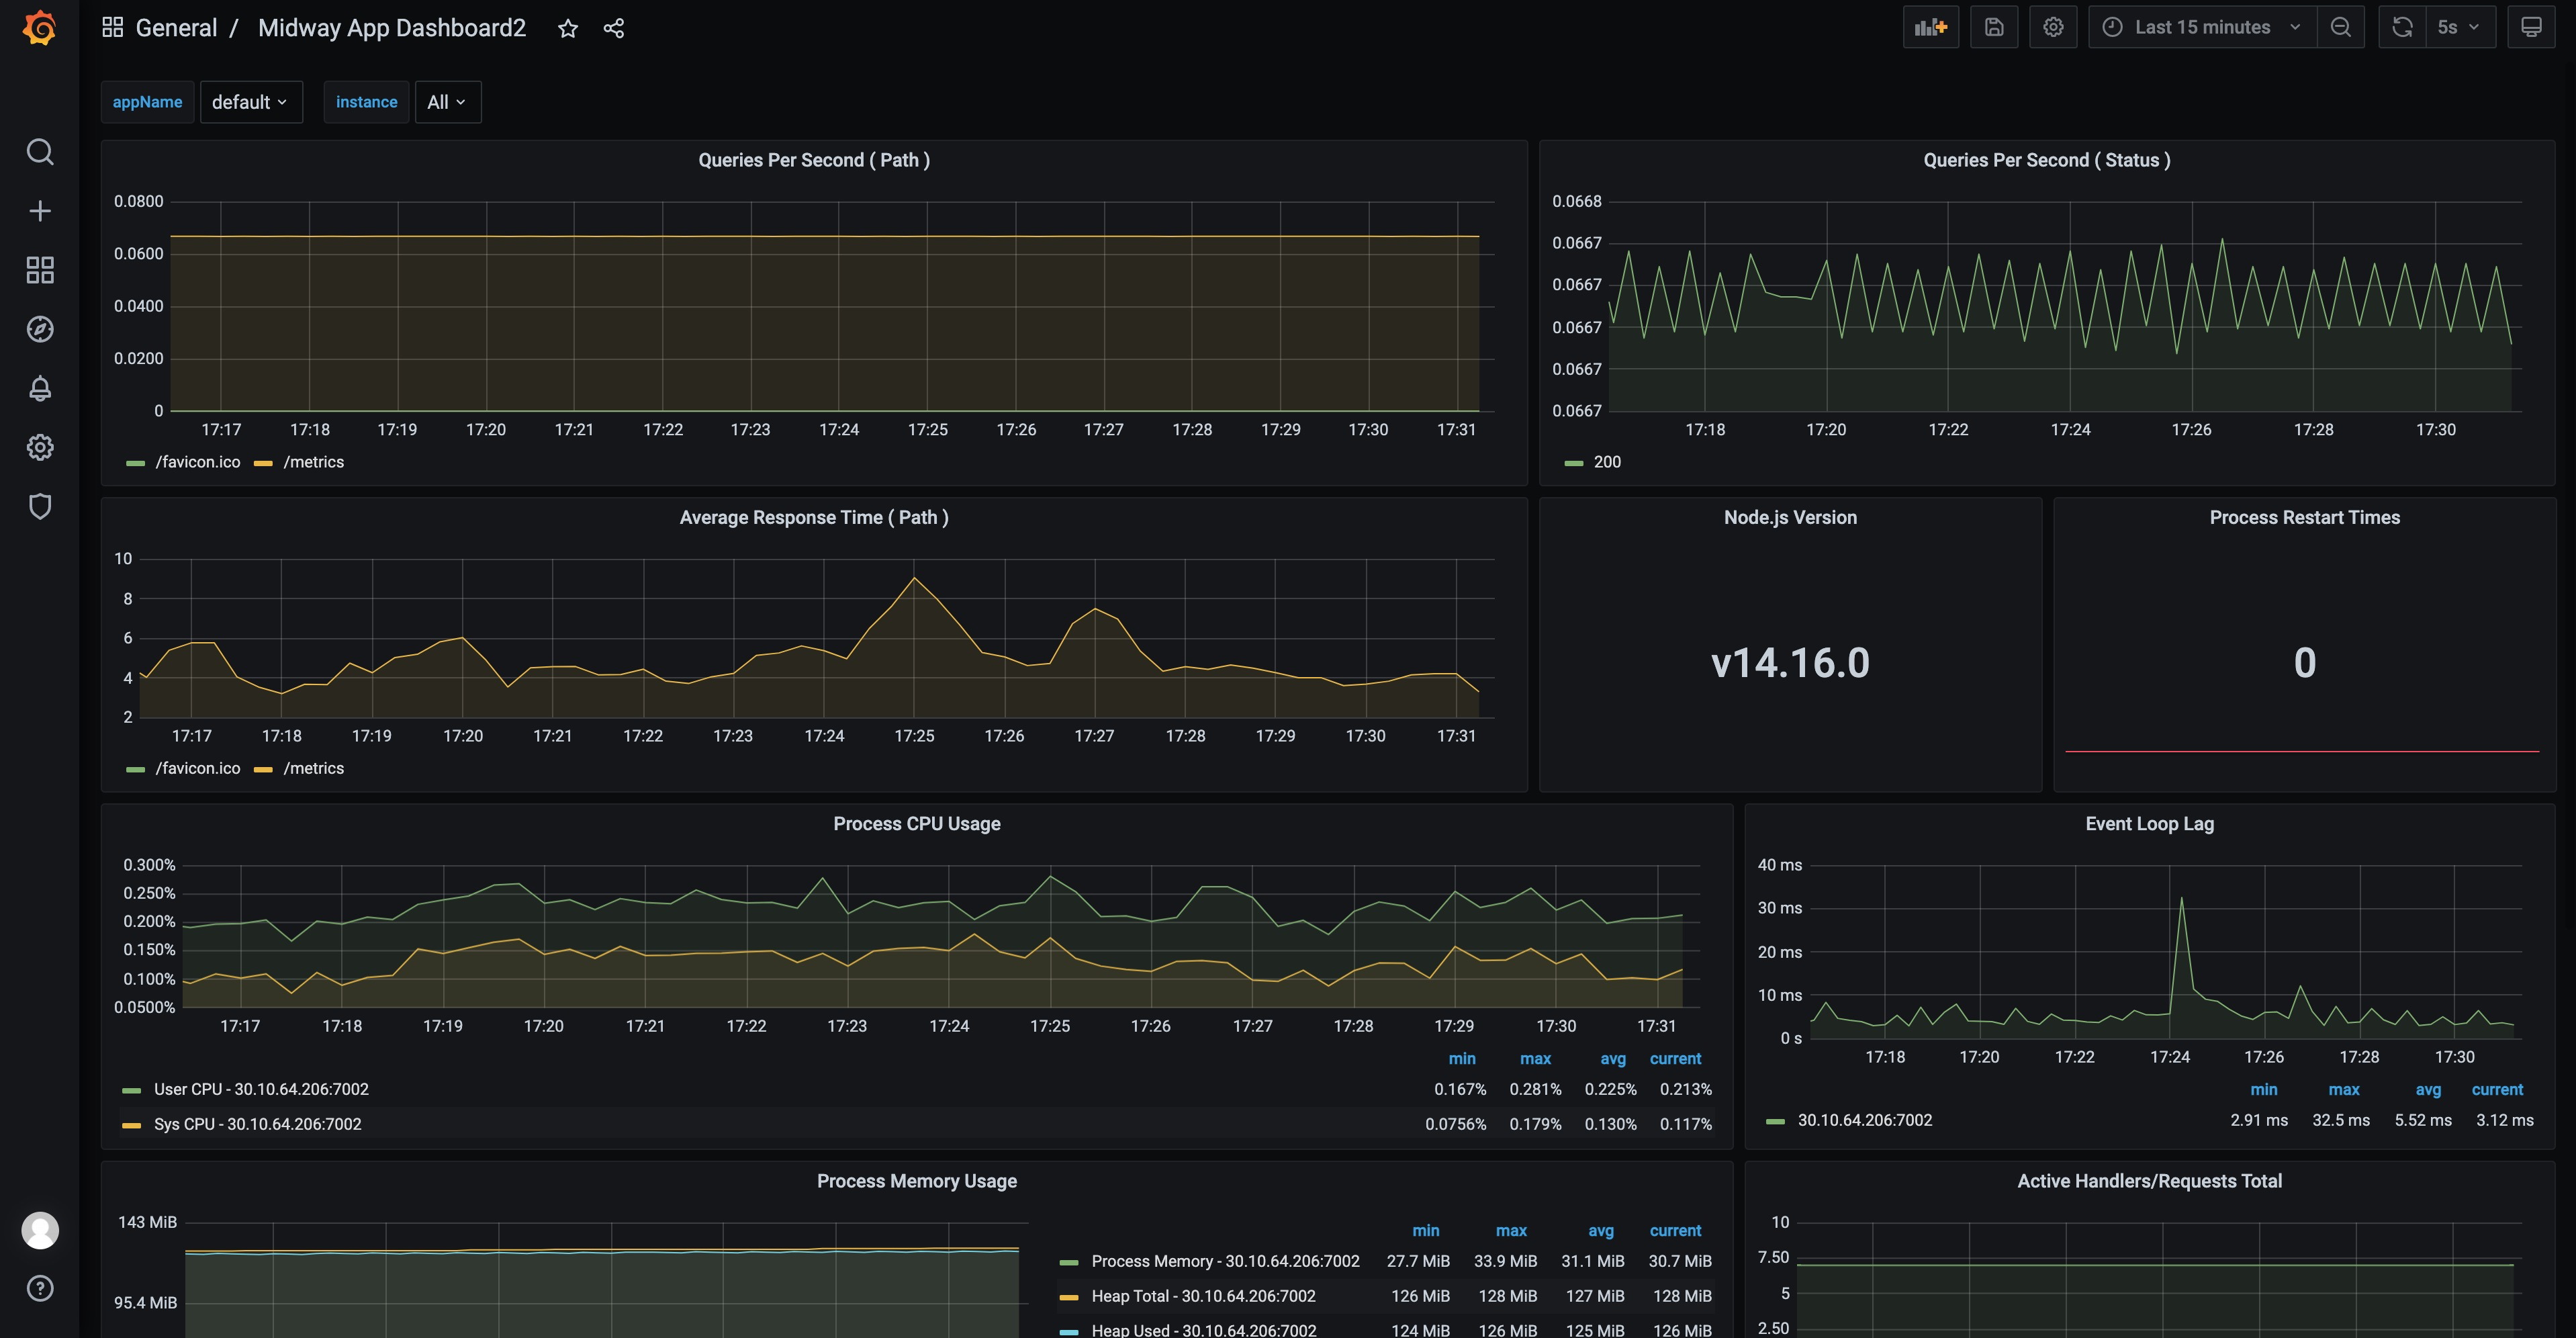
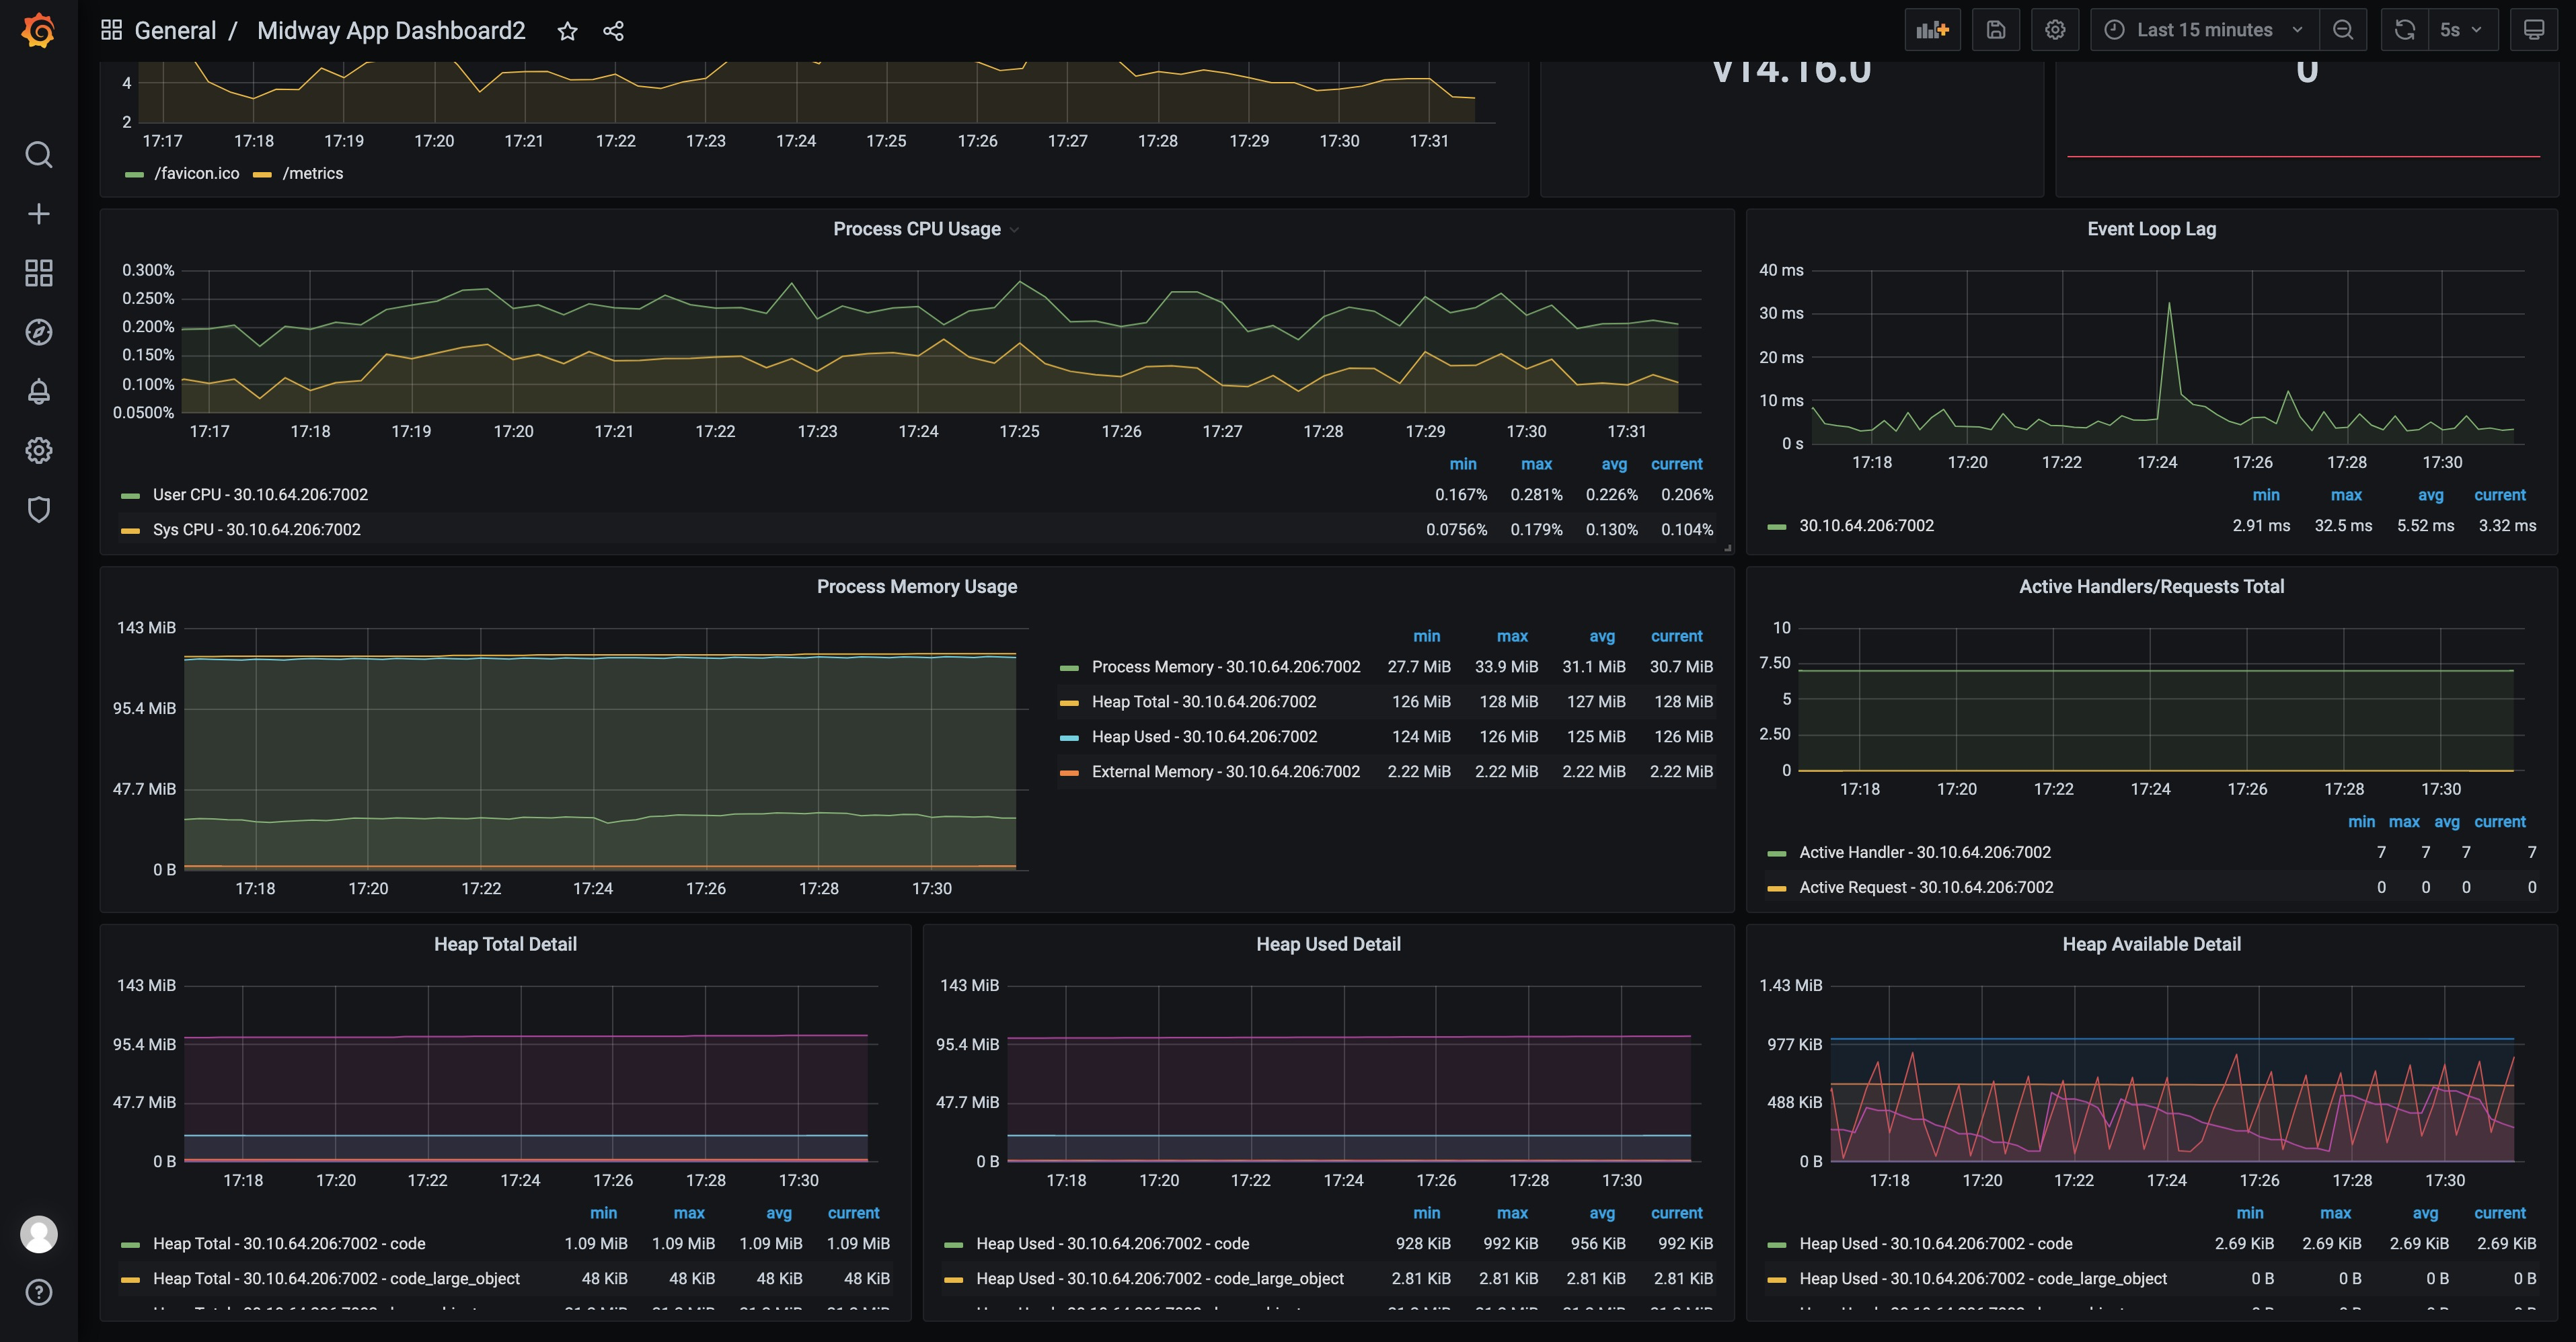
In this way, developers can operate and operate their own Node programs, for example, whether an NPM package has recently been introduced to cause any memory leakage, and whether there has been an application restart recently.
Of course, it can also support other custom operations.
Socket-io scene
Usage:
$ npm install @midwayjs/prometheus-socket-io@4 --save
Usage:
import { Configuration } from '@midwayjs/core';
import { join } from 'path';
import * as prometheus from '@midwayjs/prometheus';
import * as prometheusSocketIo from '@midwayjs/prometheus-socket-io';

@Configuration({
  imports: [prometheus, prometheusSocketIo],
  importConfigs: [join(__dirname, './config')]
})
export class MainConfiguration {}
Then you can see the socket-io data on the/metrics side.
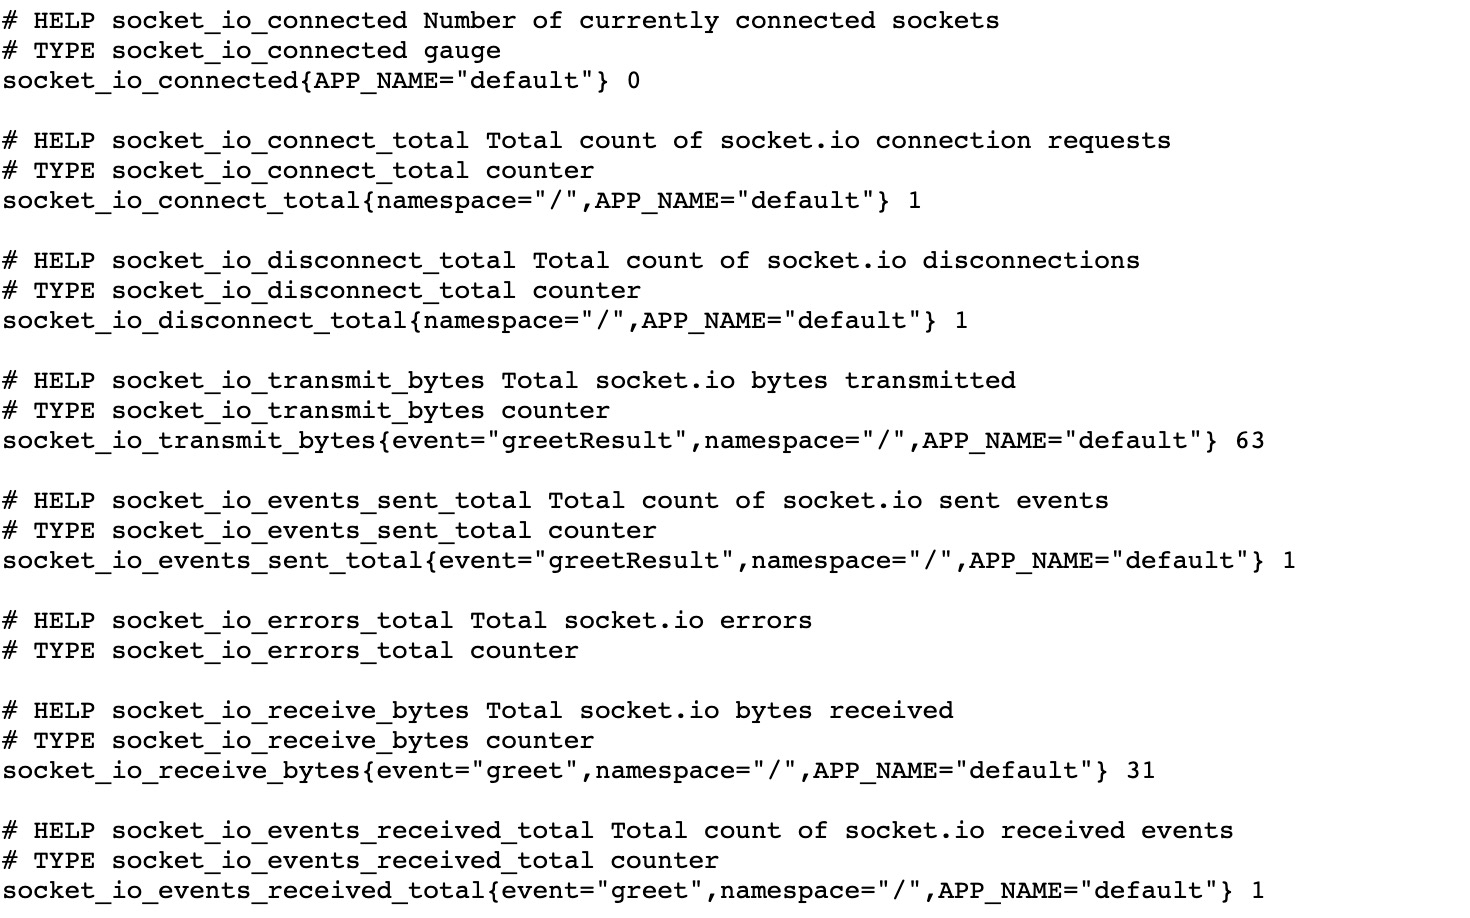
A total of 8 new indicators have been added. The Grafana template ID will be provided for everyone to use later.
Function introduction
- Sort by appName
- View the qps situation of different paths
- View the distribution of different statuses
- Query the rt situation of different paths
- CPU usage of the process
- memory usage of the process
- stack situation
- Event Loop
- Wait