本地调试
在 VSCode 中调试
方法一:使用 JavaScript Debug Teminal
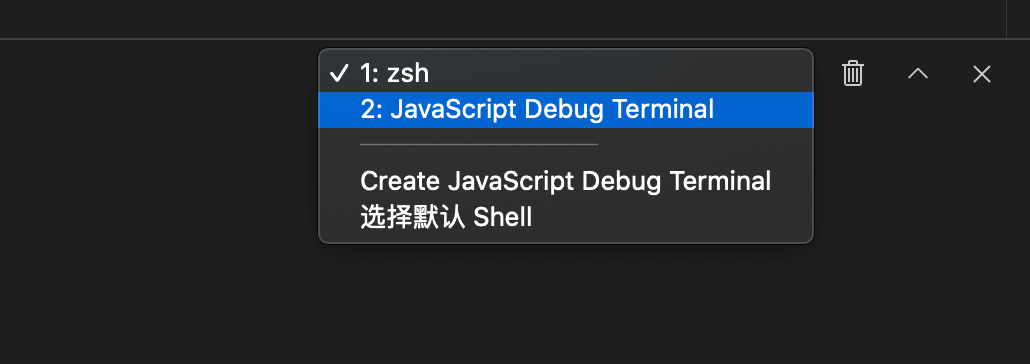
在 VSCode 的终端下拉出,隐藏着一个 JavaScript Debug Terminal ,点击它,创建出来的终端将自带调试能力。
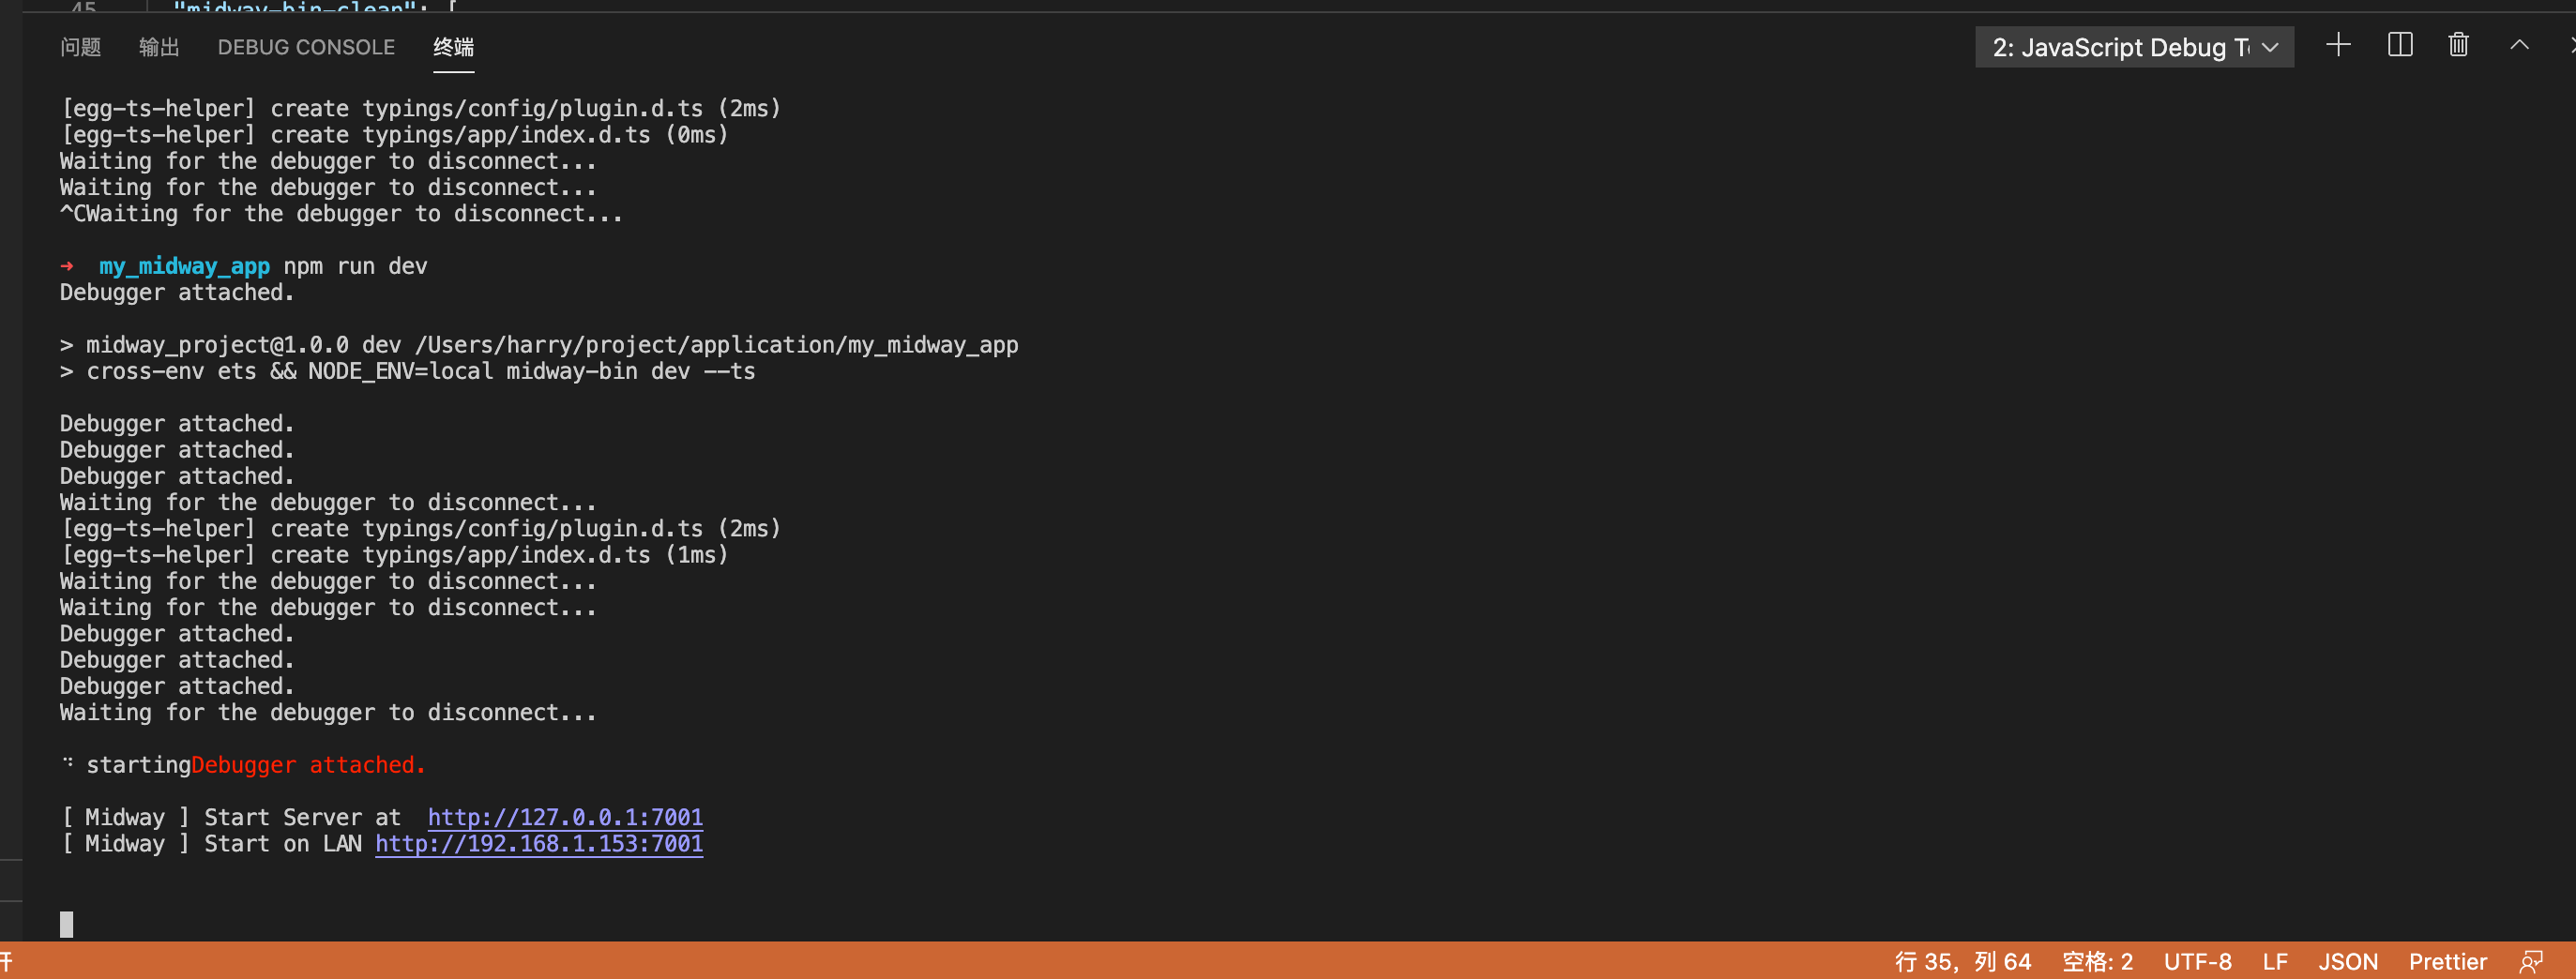
输入任意的命令都将自动开启 Debug,比如输入 npm run dev 后。
方法二:配置调试文件
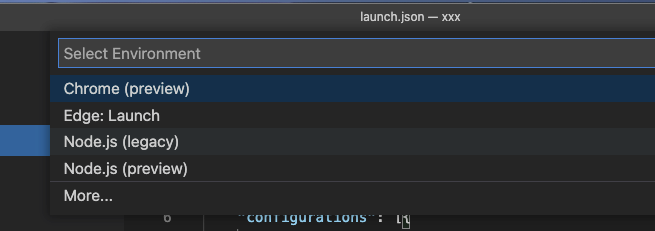
创建一个 vscode 的启动文件。
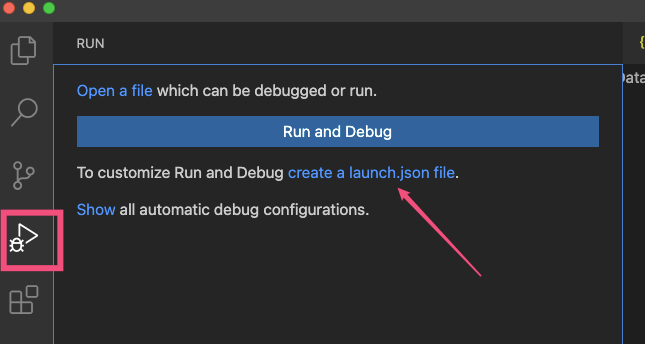
随便选一个,会创建 .vscode/launch.json 文件,
将下面内容复制进去。
{
  // 使用 IntelliSense 了解相关属性。
  // 悬停以查看现有属性的描述。
  // 欲了解更多信息,请访问: https://go.microsoft.com/fwlink/?linkid=830387
  "version": "0.2.0",
  "configurations": [
    {
      "name": "Midway Local",
      "type": "node",
      "request": "launch",
      "cwd": "${workspaceRoot}",
      "runtimeExecutable": "npm",
      "windows": {
        "runtimeExecutable": "npm.cmd"
      },
      "runtimeArgs": ["run", "dev"],
      "env": {
        "NODE_ENV": "local"
      },
      "console": "integratedTerminal",
      "protocol": "auto",
      "restart": true,
      "port": 7001,
      "autoAttachChildProcesses": true
    }
  ]
}
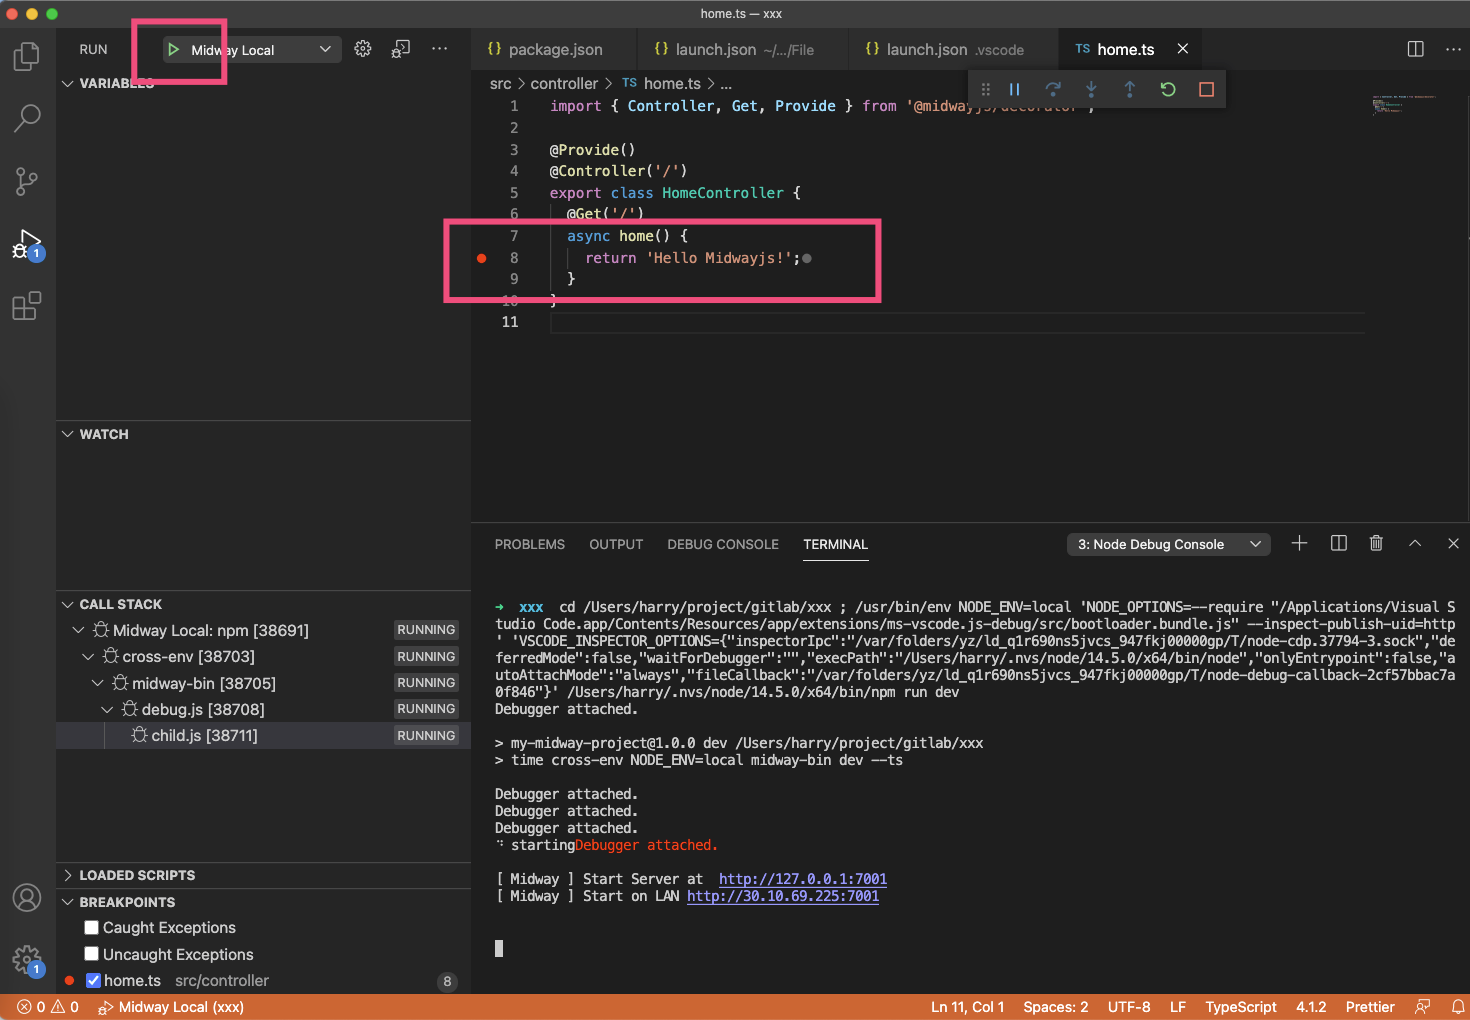
启动断点即可。
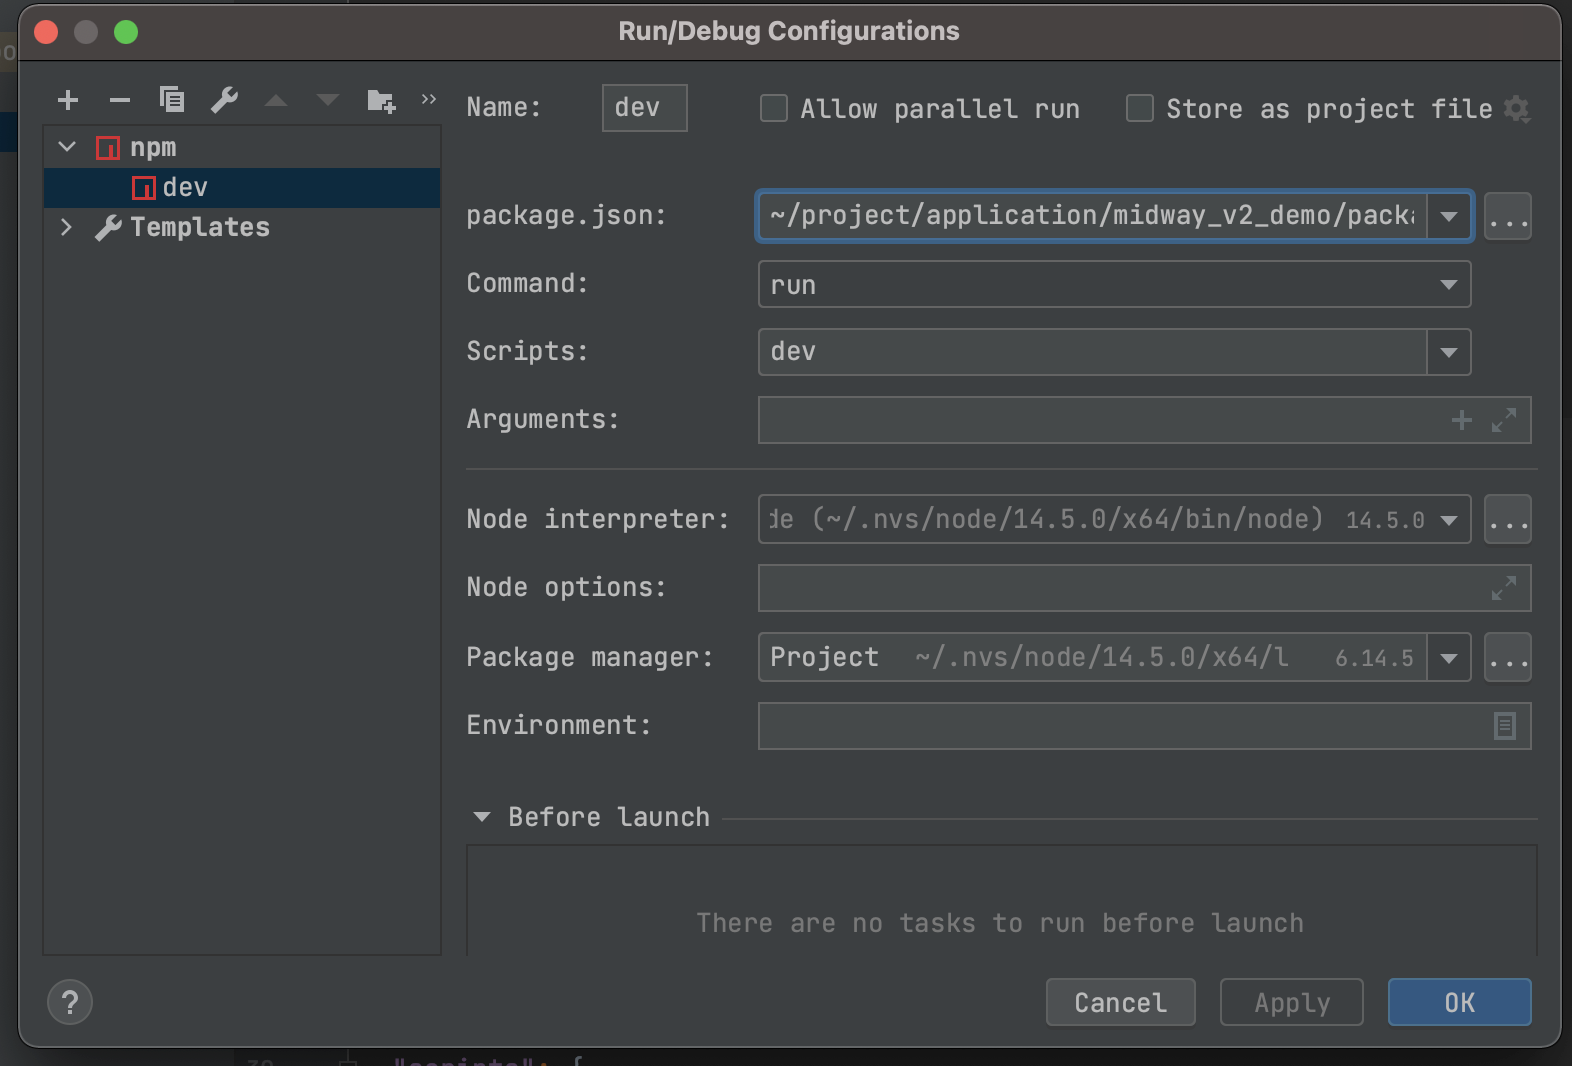
在 WebStorm/Idea 中调试
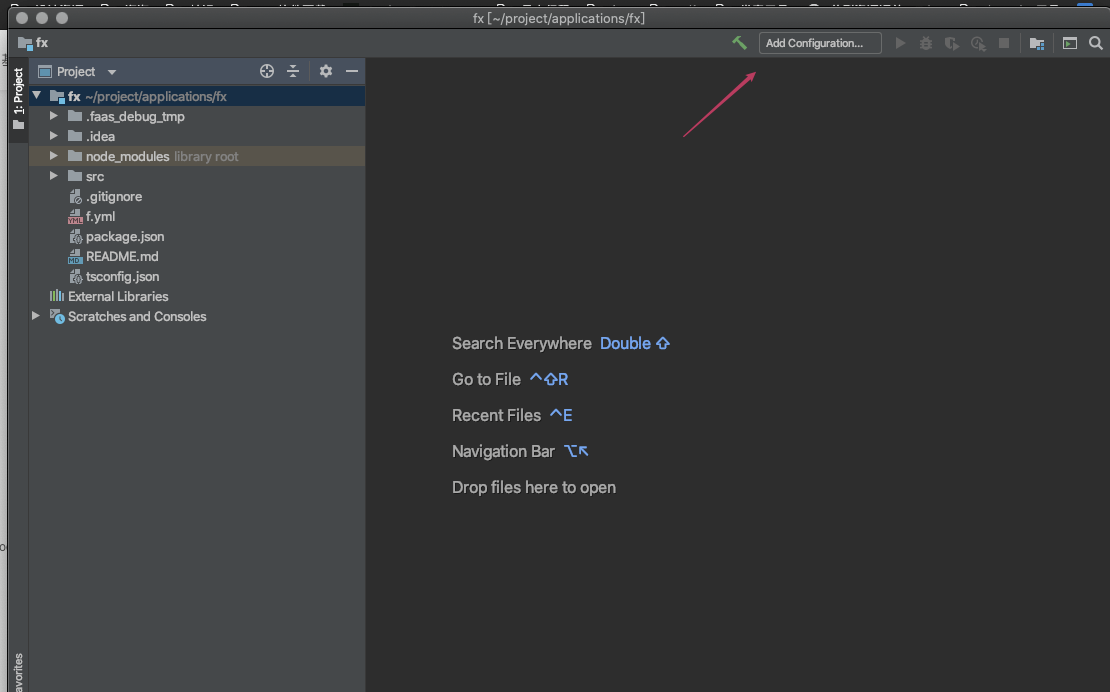
开始配置 IDE。
配置 npm 命令。
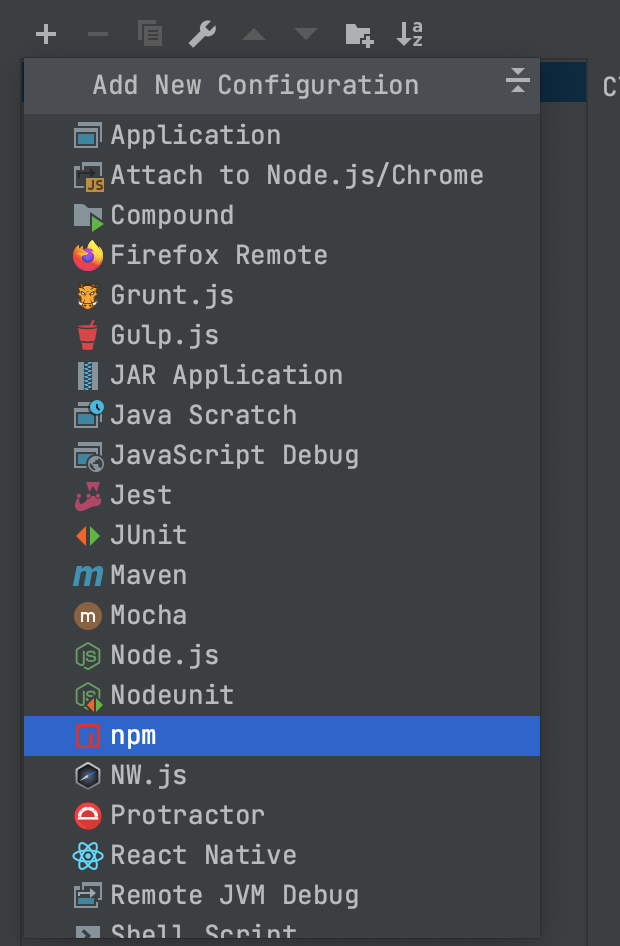
选择你的 package.json 后,下拉选择 Scrips ,其中是你 package.json 中配置好的 scripts 中的命令,选择你要的命令,比如 dev 或者 test 等即可 。
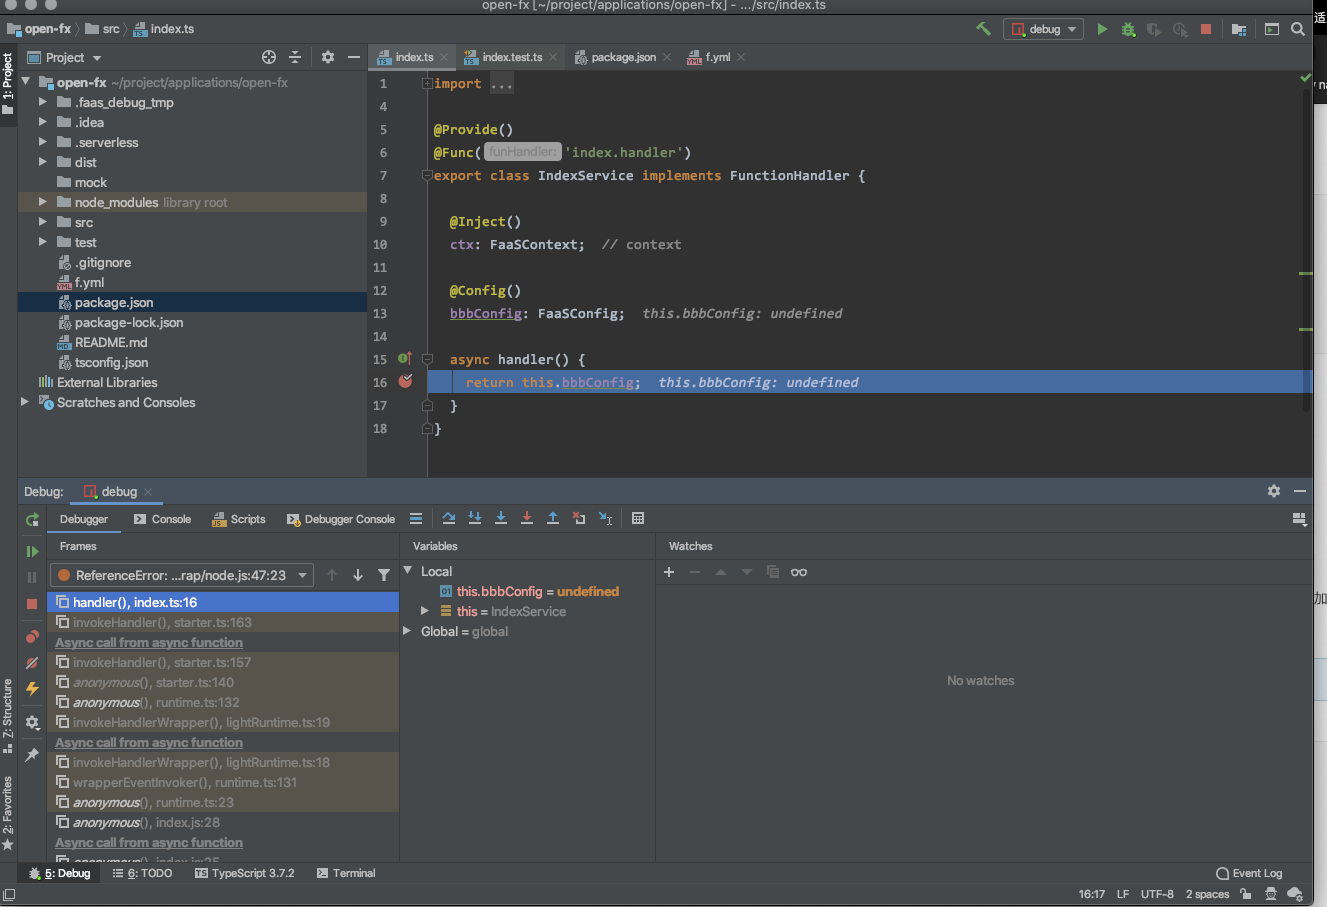
在代码上断点后执行调试即可。
在 Chrome 中调试
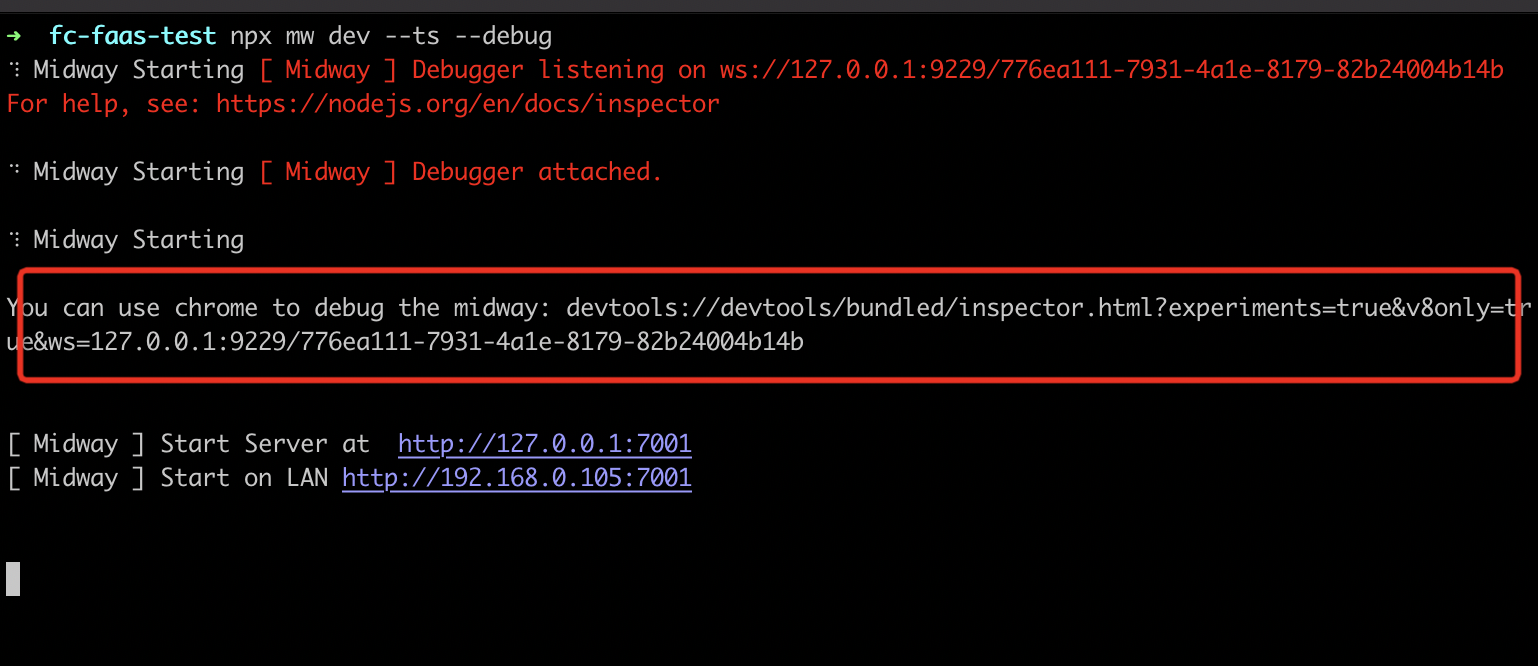
如果您使用 vim 或其他代码编辑器,可以使用此方式,通过 @midwayjs/cli 的 dev 命令,添加 --debug 参数启动 debug 模式,可以通过 chrome devtools 进行单步代码调试:
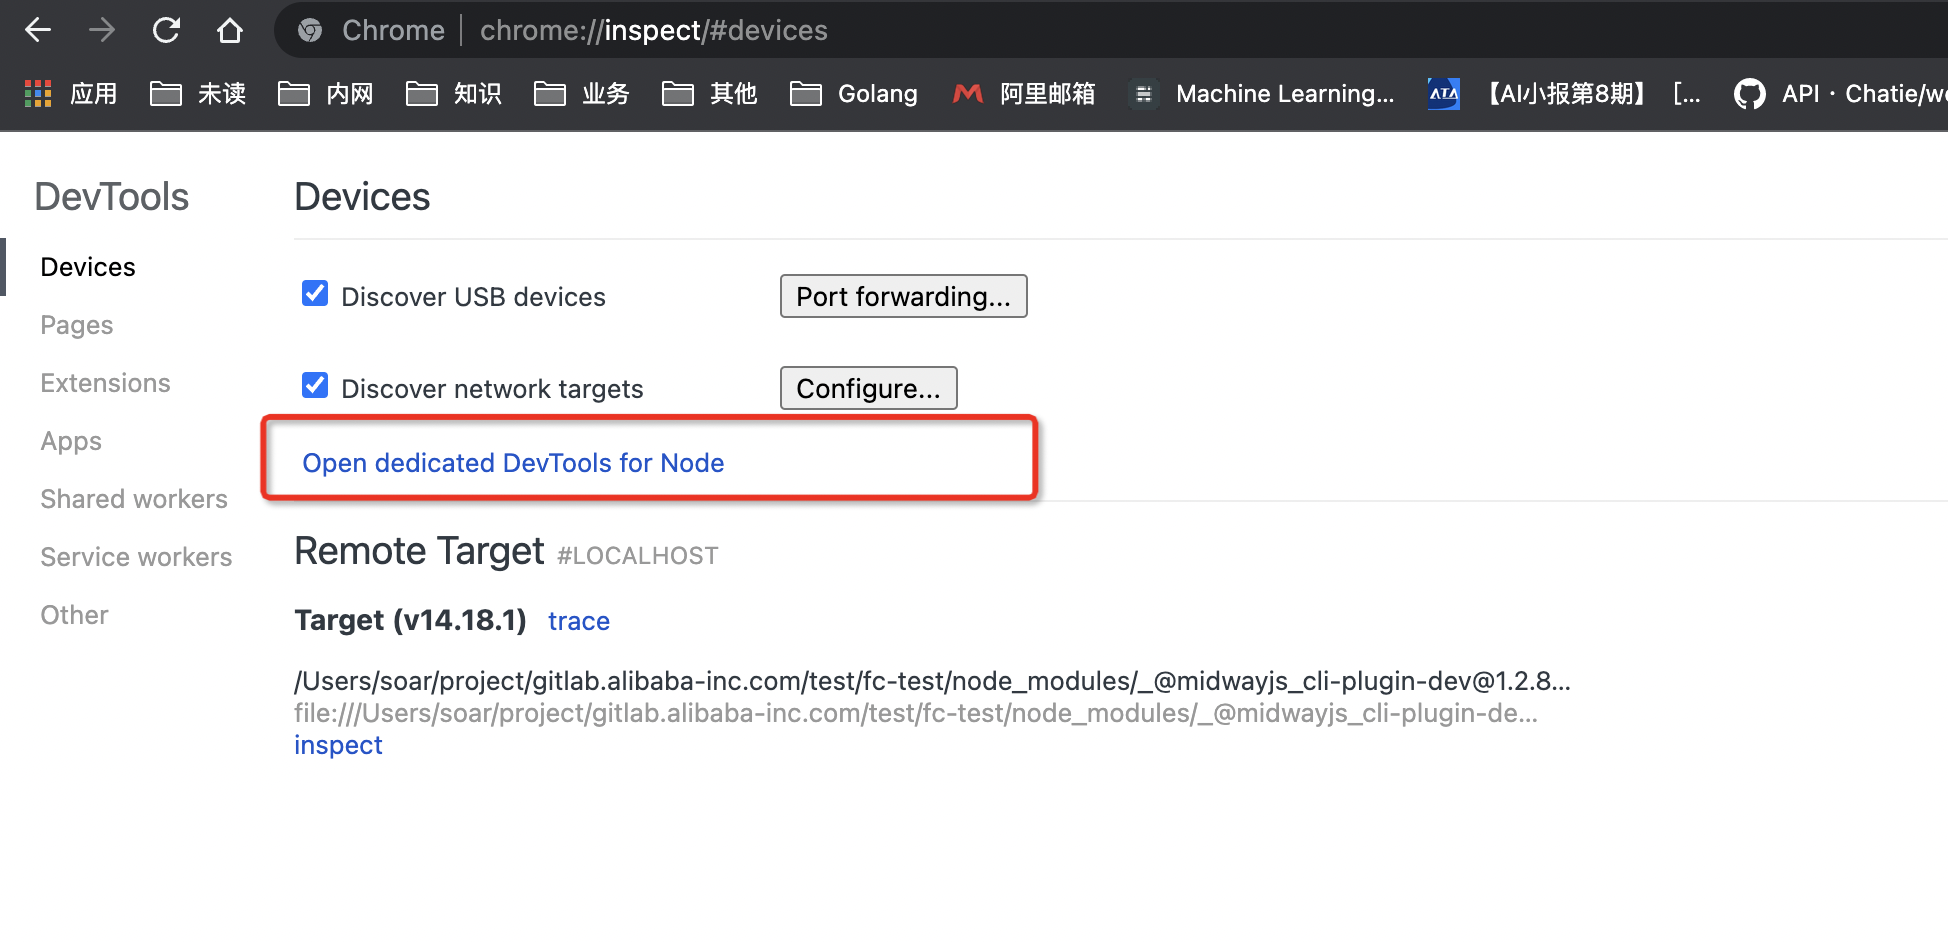
您可以通过 chrome://inspect/ 打开 nodejs devtools 进行断点调试:
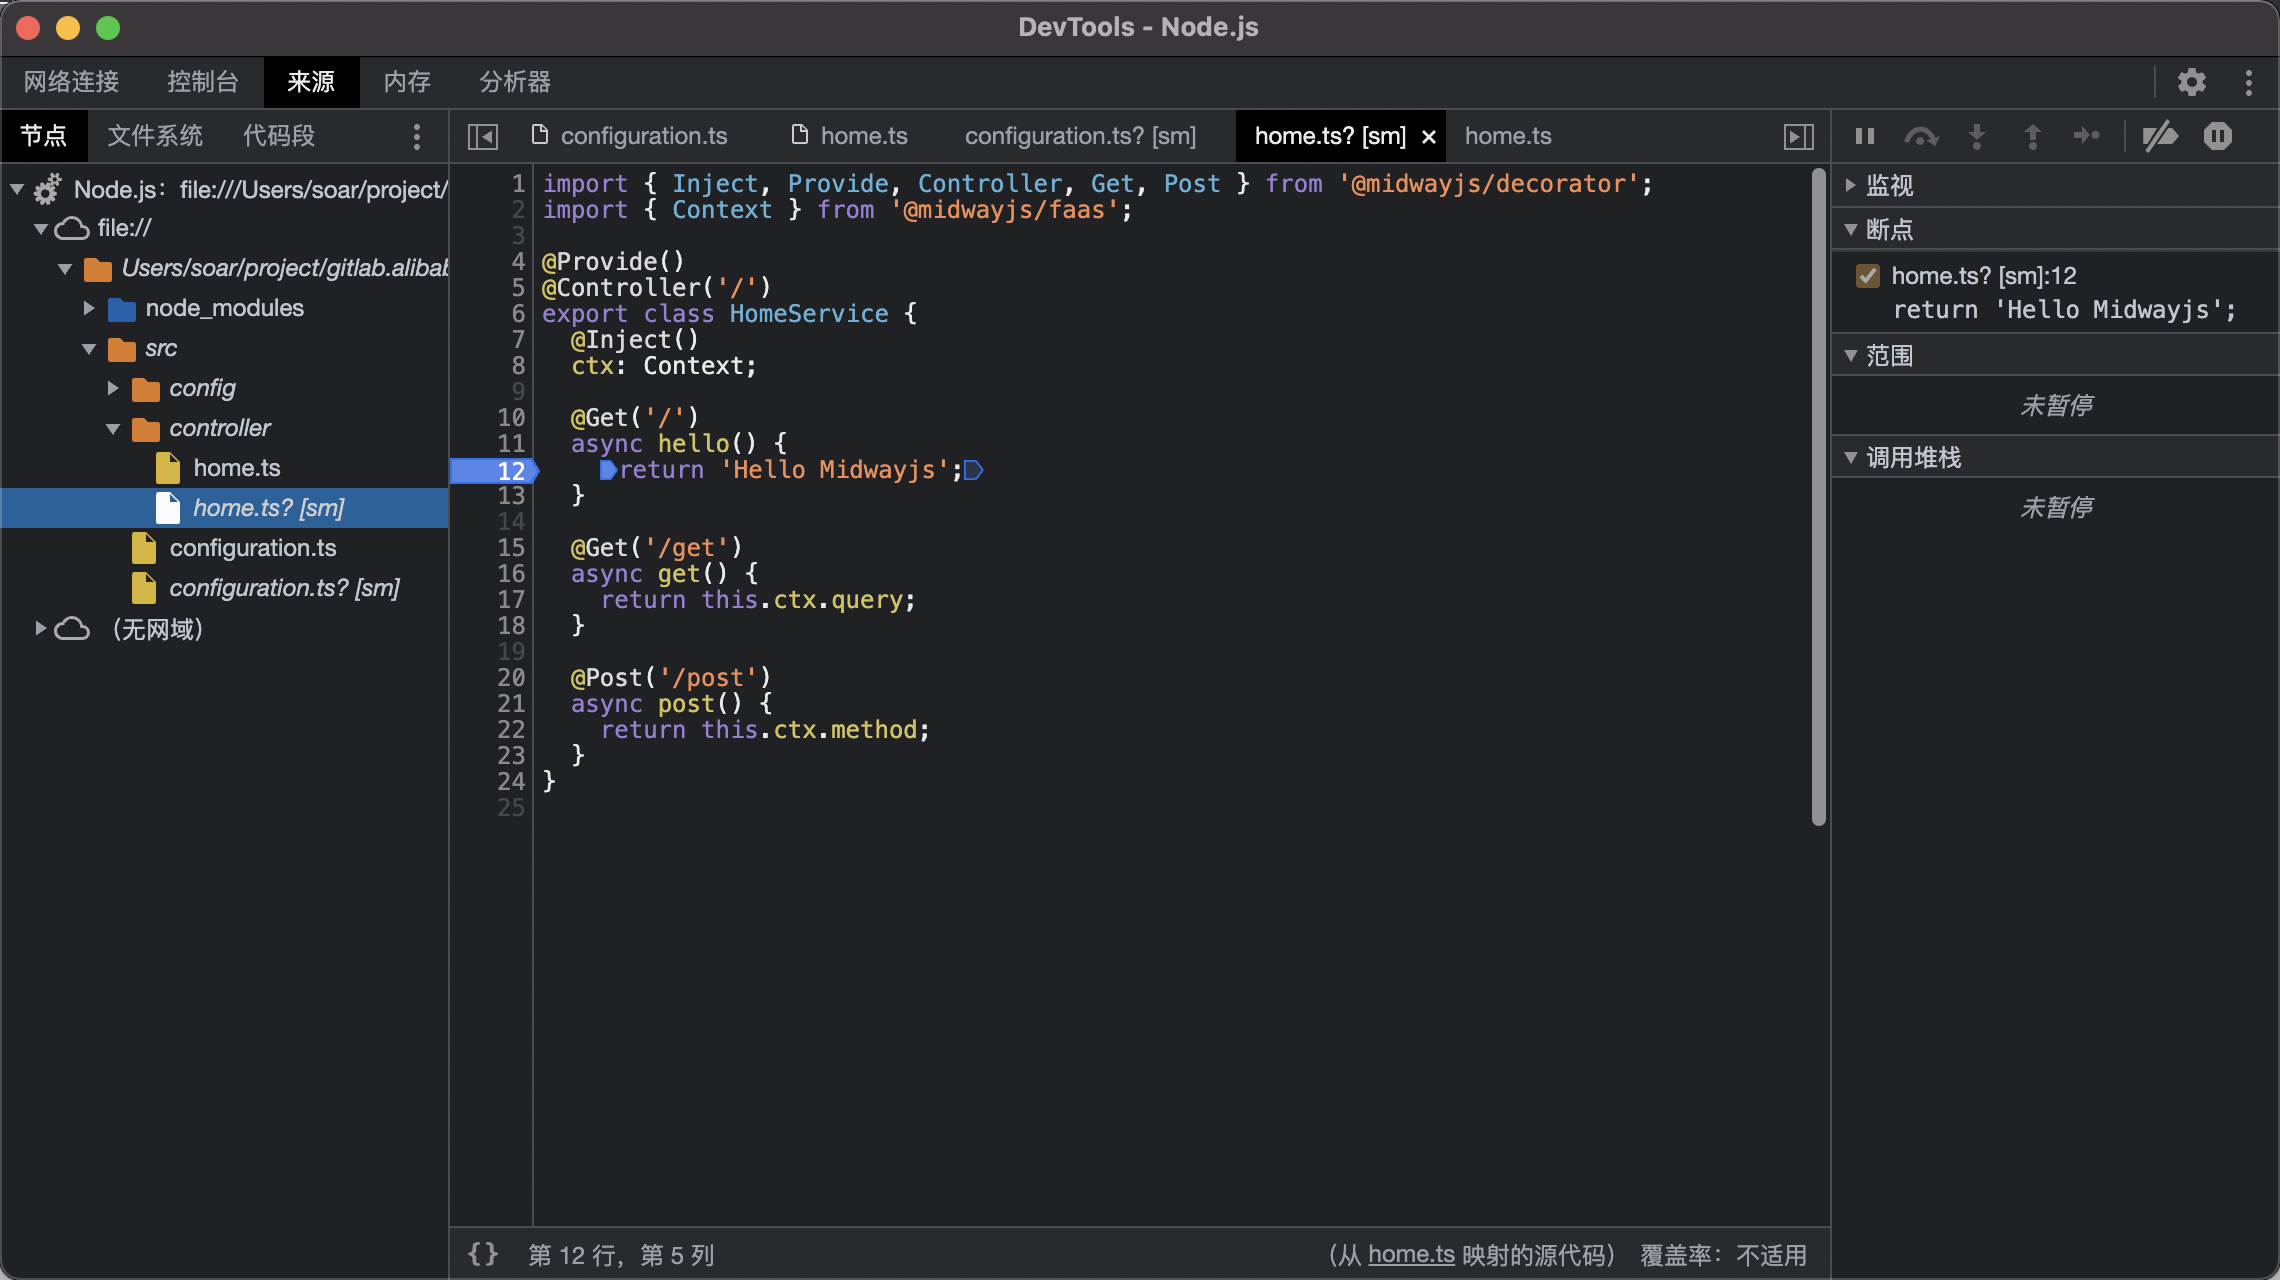
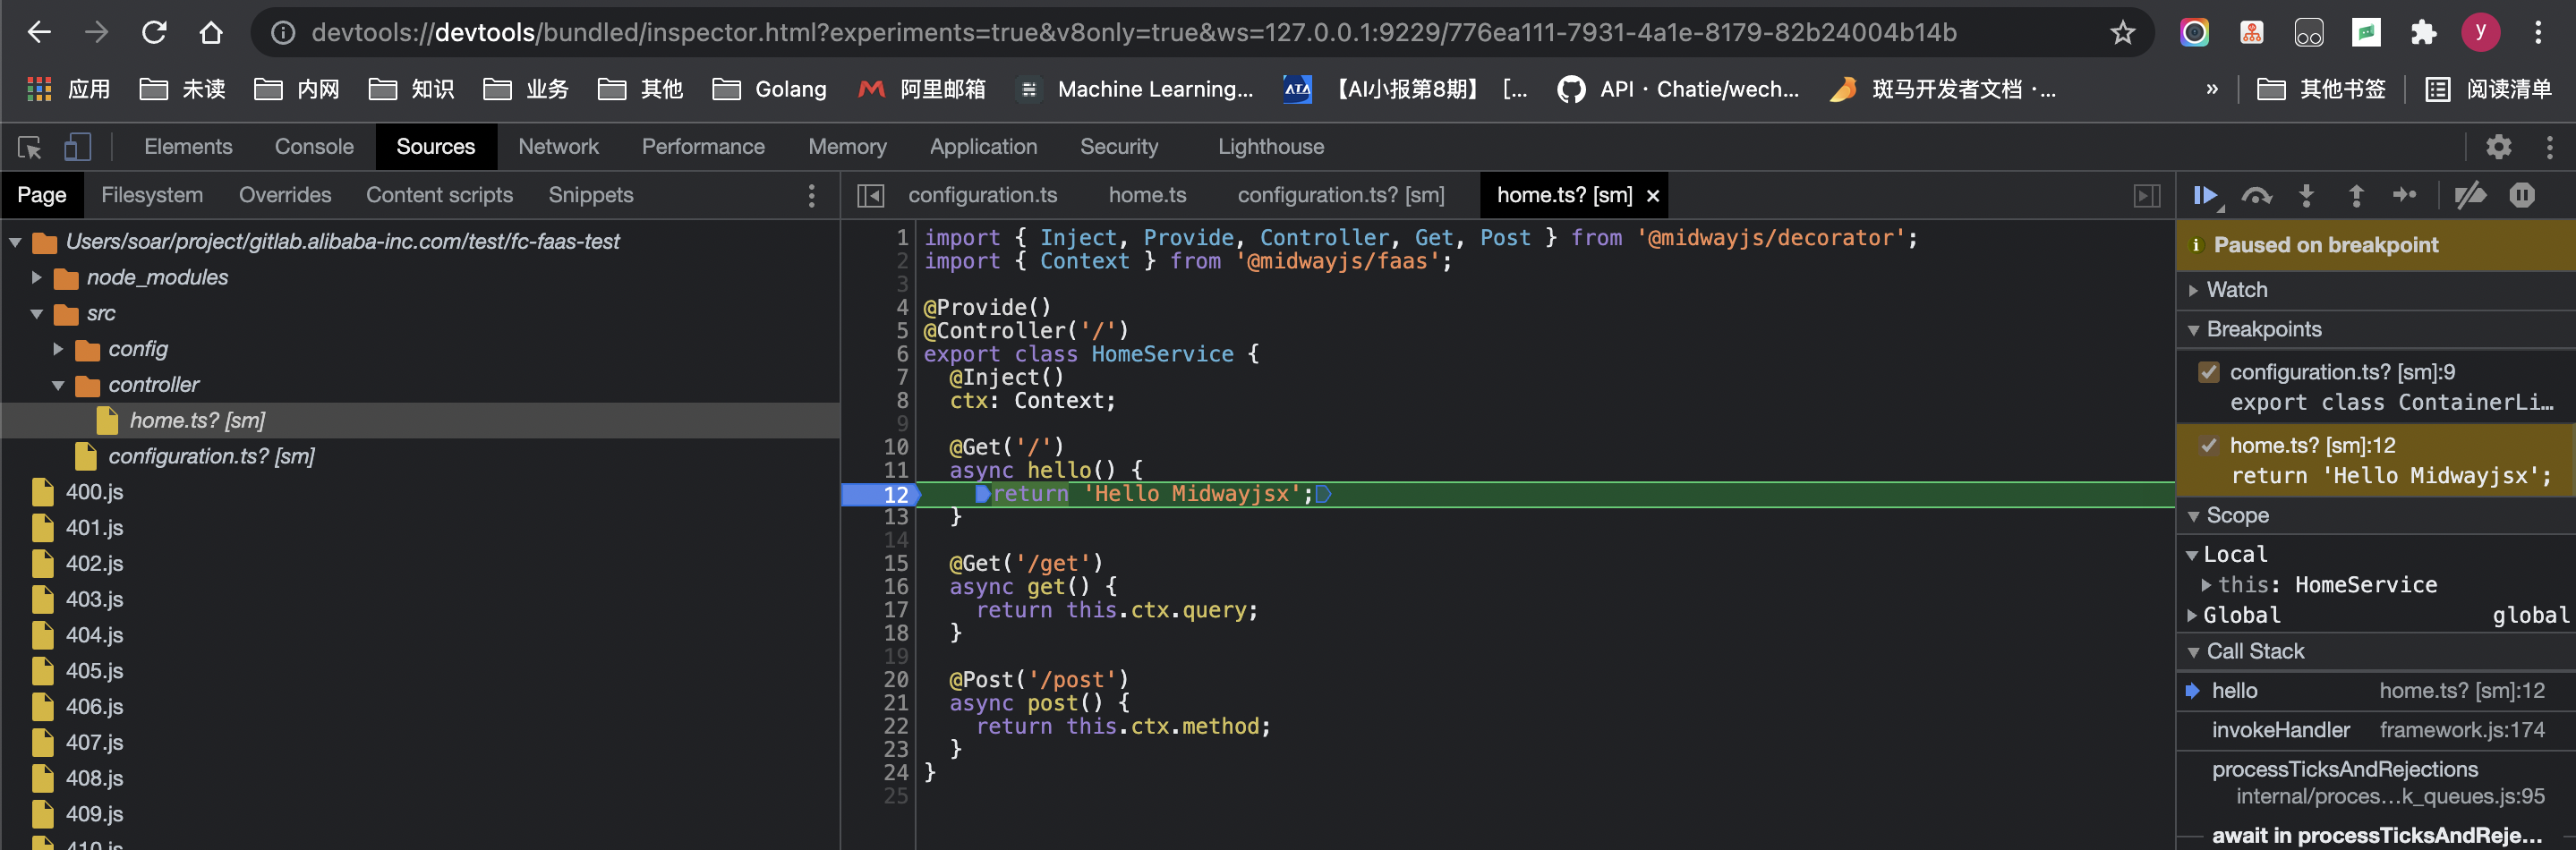
您也可以直接通过 chrome 浏览器打开命令行中输出的 devtools 协议的链接,给对应代码添加断点后调试: