Debugger
This section describes how to debug a Midway project in a common editor.
Debugging in VSCode
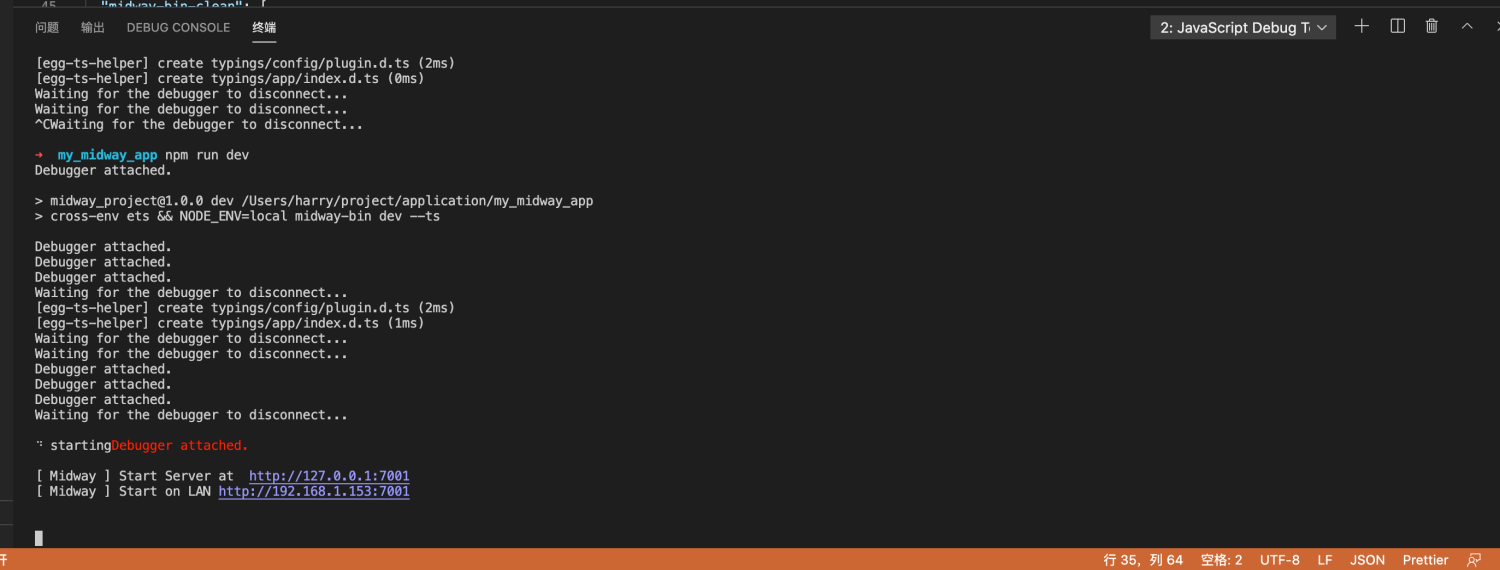
Method 1: Use JavaScript Debug Teminal
Pull out under the VSCode terminal and hide a JavaScript Debug Terminal. Click on it and the created terminal will have its own debugging capability.

If you enter any command, Debug is automatically enabled. For example, after you enter npm run dev.
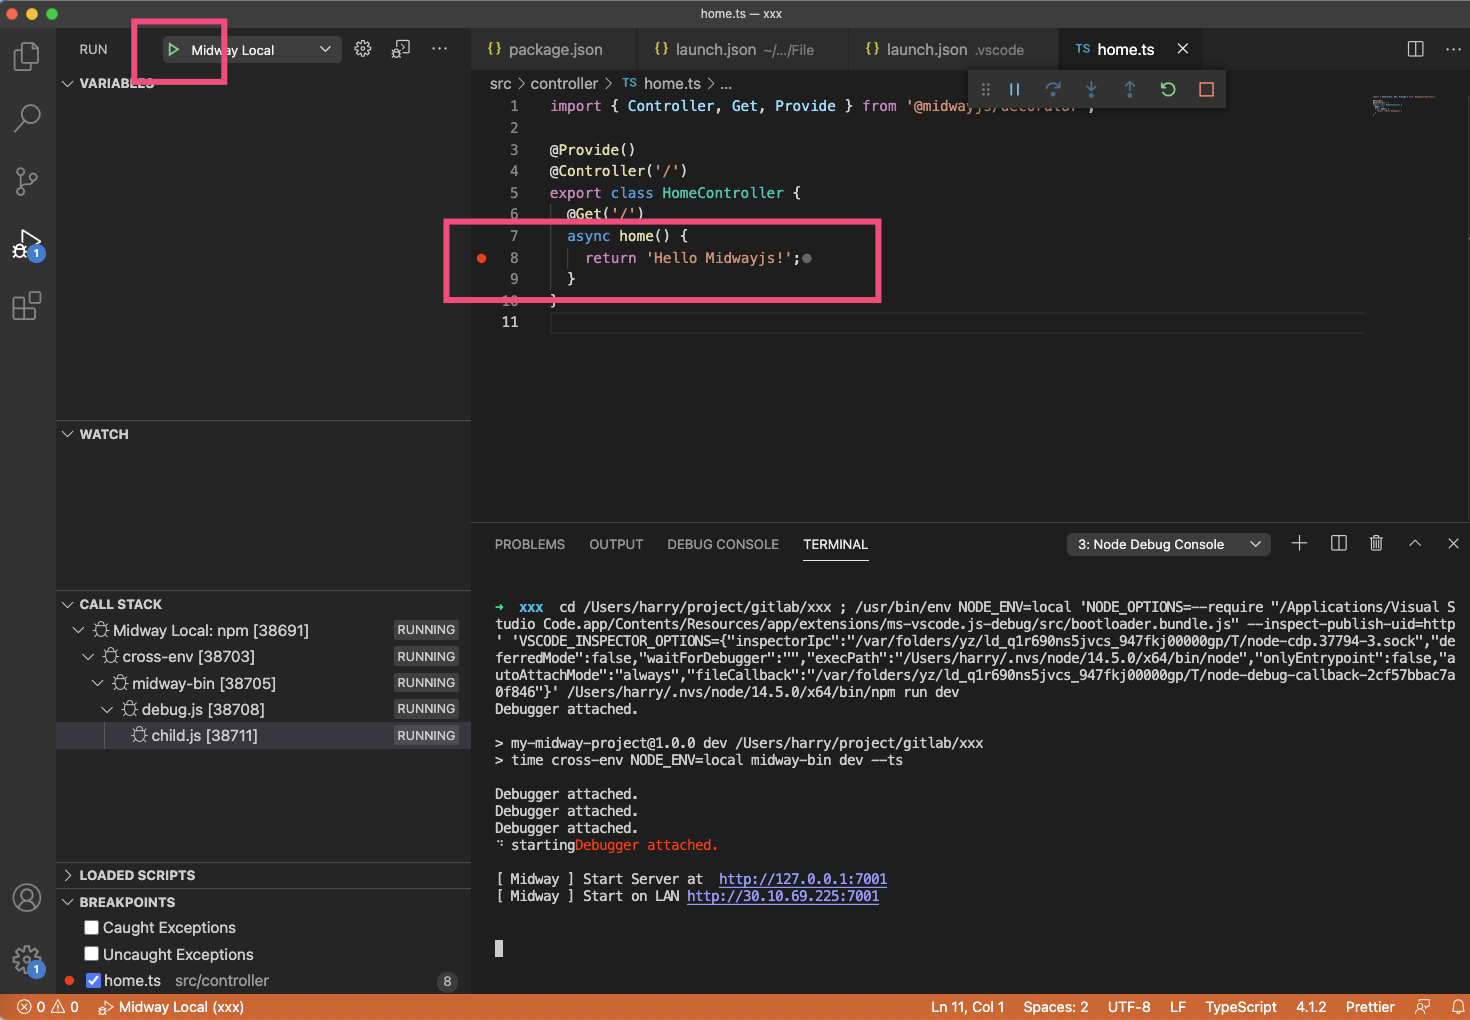
Method 2: Configure debug files
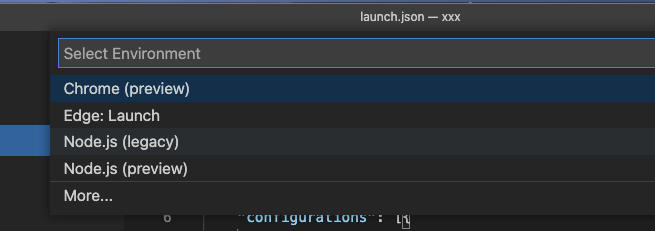
Create a startup file for vscode.
 Select any one and create a
 .vscode/launch.json file,
Copy the following.
{
    // Use IntelliSense to understand related attributes.
    // Hover to view a description of an existing attribute.
    // For more information, please visit: https://go.microsoft.com/fwlink/?linkid=830387
    "version": "0.2.0 ",
    "configurations": [{
        "name": "Midway Local ",
        "type": "node ",
        "request": "launch ",
        "cwd": "${workspaceRoot} ",
        "runtimeExecutable": "npm ",
        "windows": {
            "runtimeExecutable": "npm.cmd"
        },
        "runtimeArgs": [
            "run ",
            "dev"
        ],
        "env": {
            "NODE_ENV": "local"
        },
        "console": "integratedTerminal ",
        "protocol": "auto ",
        "restart": true
        "port": 7001
        "autoAttachChildProcesses": true
    }]
}
Just start the breakpoint.
Debugging in WebStorm/Idea
Start configuring IDE.
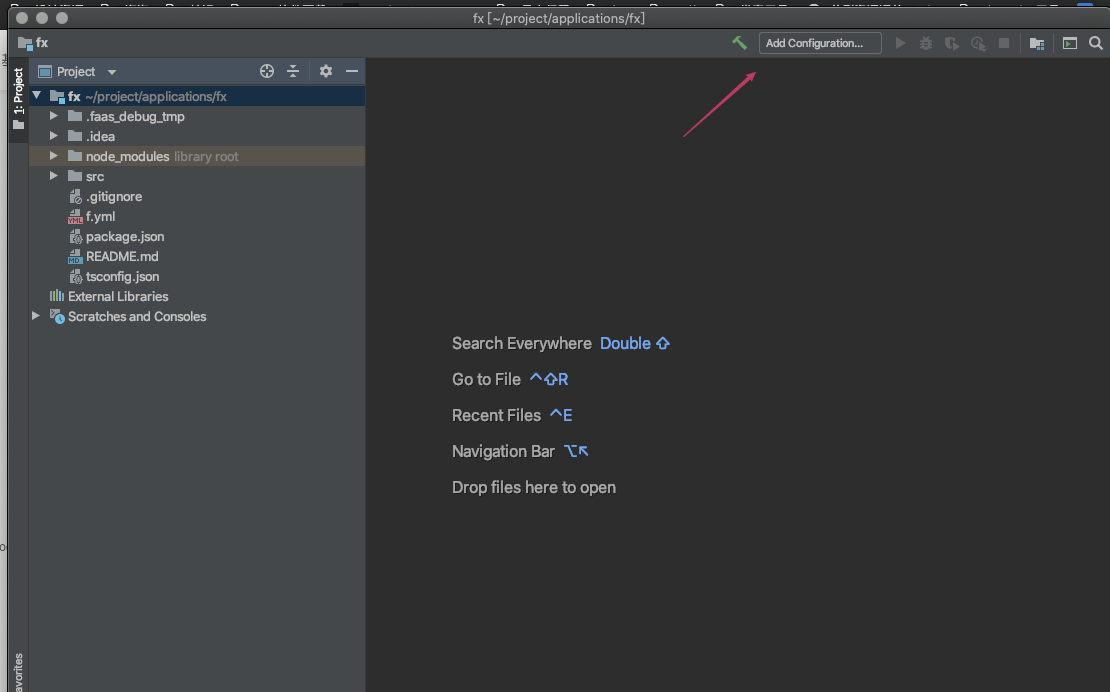
Configure the npm command.

After you select package.json, drop down and select Scrips, which is the command in the scripts configured in package.json. Select the command you want, such as dev or test.

Debugging can be performed after the code breakpoint.
